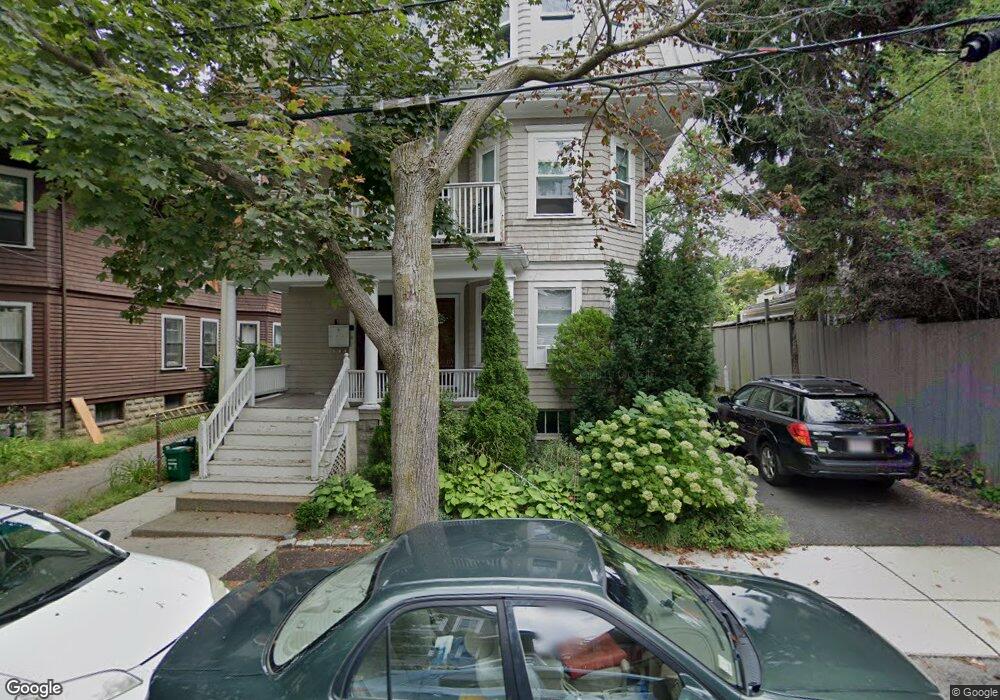
10 Granville Rd Unit 12 Cambridge, MA 02138
West Cambridge NeighborhoodEstimated Value: $869,661 - $979,000
2
Beds
1
Bath
1,062
Sq Ft
$860/Sq Ft
Est. Value
About This Home
This home is located at 10 Granville Rd Unit 12, Cambridge, MA 02138 and is currently estimated at $912,915, approximately $859 per square foot. 10 Granville Rd Unit 12 is a home located in Middlesex County with nearby schools including Benjamin Banneker Charter Public School, Cambridge Montessori School, and St Peter School.
Ownership History
Date
Name
Owned For
Owner Type
Purchase Details
Closed on
Dec 20, 2005
Sold by
Brooks John R and Brooks Michelle S
Bought by
Fox Amy and Fox John A
Current Estimated Value
Home Financials for this Owner
Home Financials are based on the most recent Mortgage that was taken out on this home.
Original Mortgage
$336,000
Interest Rate
6.34%
Mortgage Type
Purchase Money Mortgage
Purchase Details
Closed on
Oct 10, 2003
Sold by
Brooks John R
Bought by
Brooks Michelle S and Brooks John R
Purchase Details
Closed on
Aug 3, 1999
Sold by
Shapiro Mary E and Shapiro Steven B
Bought by
Brooks John R
Home Financials for this Owner
Home Financials are based on the most recent Mortgage that was taken out on this home.
Original Mortgage
$210,000
Interest Rate
7.61%
Mortgage Type
Purchase Money Mortgage
Create a Home Valuation Report for This Property
The Home Valuation Report is an in-depth analysis detailing your home's value as well as a comparison with similar homes in the area
Home Values in the Area
Average Home Value in this Area
Purchase History
| Date | Buyer | Sale Price | Title Company |
|---|---|---|---|
| Fox Amy | $420,000 | -- | |
| Brooks Michelle S | -- | -- | |
| Brooks John R | $263,000 | -- |
Source: Public Records
Mortgage History
| Date | Status | Borrower | Loan Amount |
|---|---|---|---|
| Open | Brooks John R | $301,000 | |
| Closed | Fox Amy | $336,000 | |
| Previous Owner | Brooks John R | $210,000 |
Source: Public Records
Tax History Compared to Growth
Tax History
| Year | Tax Paid | Tax Assessment Tax Assessment Total Assessment is a certain percentage of the fair market value that is determined by local assessors to be the total taxable value of land and additions on the property. | Land | Improvement |
|---|---|---|---|---|
| 2025 | $4,841 | $762,300 | $0 | $762,300 |
| 2024 | $4,481 | $757,000 | $0 | $757,000 |
| 2023 | $4,298 | $733,500 | $0 | $733,500 |
| 2022 | $4,190 | $723,200 | $0 | $723,200 |
| 2021 | $4,190 | $716,300 | $0 | $716,300 |
| 2020 | $4,051 | $704,600 | $0 | $704,600 |
| 2019 | $3,914 | $658,900 | $0 | $658,900 |
| 2018 | $3,929 | $609,400 | $0 | $609,400 |
| 2017 | $3,669 | $565,400 | $0 | $565,400 |
| 2016 | $3,568 | $510,400 | $0 | $510,400 |
| 2015 | $3,527 | $451,000 | $0 | $451,000 |
| 2014 | $3,468 | $413,800 | $0 | $413,800 |
Source: Public Records
Map
Nearby Homes
- 71-73 Reservoir St
- 92 Fayerweather St Unit 2
- 422-424 Walden St
- 31 Chilton St Unit 1
- 234 Huron Ave
- 382 Huron Ave
- 32 Copley St Unit 2
- 156 Fayerweather St Unit 156
- 18 Donnell St
- 14-16 Field St
- 5 Field St
- 148 Huron Ave
- 243 Lexington Ave
- 134 Lexington Ave Unit 2
- 153 Brattle St
- 107 Grozier Rd Unit 1
- 8 Holly Ave Unit 1
- 172 Brattle St
- 158 Brattle St
- 465 Huron Ave Unit 1
- 10 Granville Rd Unit 12
- 10 Granville Rd Unit 12
- 10 Granville Rd Unit 1
- 12 Granville Rd Unit 3
- 14 Granville Rd
- 14 Granville Rd Unit 2
- 14 Granville Rd Unit 1
- 14 Granville Rd Unit 3
- 309 Huron Ave
- 309 Huron Ave Unit 1
- 69 Reservoir St
- 69 Reservoir St Unit 1
- 18 Granville Rd
- 301 Huron Ave Unit 1
- 301 Huron Ave
- 301 Huron Ave Unit 2
- 301 Huron Ave Unit 301
- 71 Reservoir St
- 67 Reservoir St
- 79 Granville Rd Unit 3