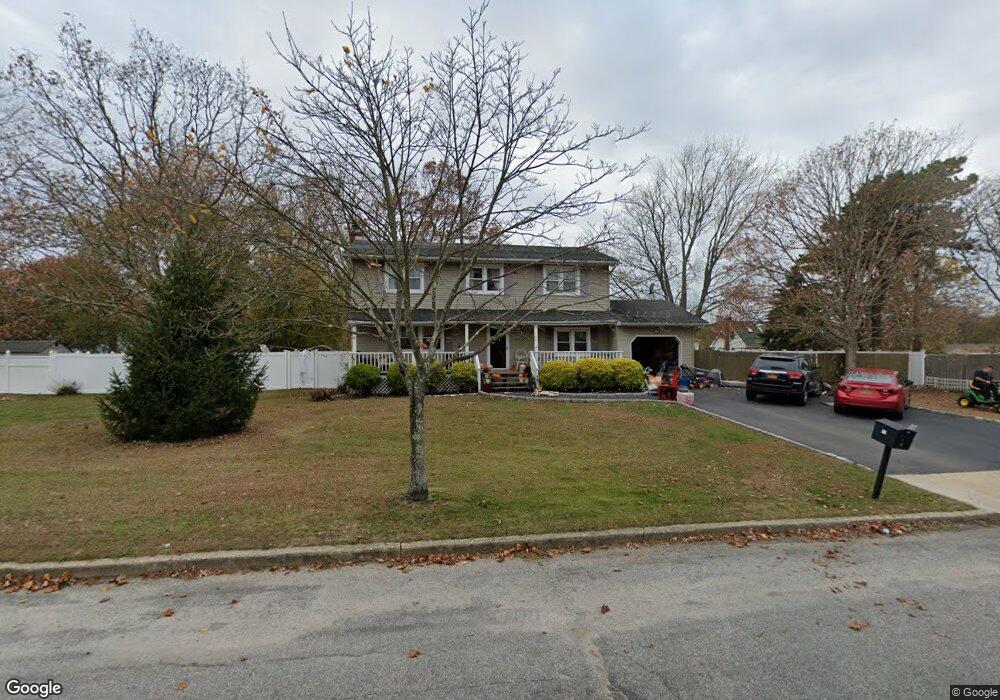
10 Gregg St East Patchogue, NY 11772
Estimated Value: $616,110 - $665,000
4
Beds
2
Baths
1,748
Sq Ft
$368/Sq Ft
Est. Value
About This Home
This home is located at 10 Gregg St, East Patchogue, NY 11772 and is currently estimated at $644,028, approximately $368 per square foot. 10 Gregg St is a home located in Suffolk County with nearby schools including Frank P Long Intermediate School, Bellport Middle School, and Bellport Senior High School.
Ownership History
Date
Name
Owned For
Owner Type
Purchase Details
Closed on
Sep 29, 2006
Sold by
Fudge Diane
Bought by
Fudge Mark
Current Estimated Value
Purchase Details
Closed on
Feb 15, 2000
Sold by
Birdsall Russell and Cicillini Dina E
Bought by
Fudge Roger and Fudge Diane M
Home Financials for this Owner
Home Financials are based on the most recent Mortgage that was taken out on this home.
Original Mortgage
$129,857
Interest Rate
8.21%
Mortgage Type
FHA
Purchase Details
Closed on
Jul 30, 1998
Sold by
Ambition Realty Corp
Bought by
Birdsall Russell E and Cicillini Dina E
Home Financials for this Owner
Home Financials are based on the most recent Mortgage that was taken out on this home.
Original Mortgage
$147,000
Interest Rate
6.9%
Mortgage Type
FHA
Purchase Details
Closed on
Mar 2, 1998
Sold by
United States Trust Co
Bought by
Ambition Realty Corp
Create a Home Valuation Report for This Property
The Home Valuation Report is an in-depth analysis detailing your home's value as well as a comparison with similar homes in the area
Home Values in the Area
Average Home Value in this Area
Purchase History
| Date | Buyer | Sale Price | Title Company |
|---|---|---|---|
| Fudge Mark | $400,000 | George Fluaxis | |
| Fudge Roger | $177,000 | -- | |
| Birdsall Russell E | $151,000 | -- | |
| Ambition Realty Corp | $86,000 | Commonwealth Land Title Ins |
Source: Public Records
Mortgage History
| Date | Status | Borrower | Loan Amount |
|---|---|---|---|
| Previous Owner | Fudge Roger | $129,857 | |
| Previous Owner | Birdsall Russell E | $147,000 |
Source: Public Records
Tax History
| Year | Tax Paid | Tax Assessment Tax Assessment Total Assessment is a certain percentage of the fair market value that is determined by local assessors to be the total taxable value of land and additions on the property. | Land | Improvement |
|---|---|---|---|---|
| 2024 | $10,377 | $2,675 | $400 | $2,275 |
| 2023 | $10,377 | $2,675 | $400 | $2,275 |
| 2022 | $9,170 | $2,675 | $400 | $2,275 |
| 2021 | $9,170 | $2,675 | $400 | $2,275 |
| 2020 | $9,556 | $2,675 | $400 | $2,275 |
| 2019 | $9,556 | $0 | $0 | $0 |
| 2018 | $8,918 | $2,675 | $400 | $2,275 |
| 2017 | $8,918 | $2,675 | $400 | $2,275 |
| 2016 | $8,884 | $2,675 | $400 | $2,275 |
| 2015 | -- | $2,675 | $400 | $2,275 |
| 2014 | -- | $2,675 | $400 | $2,275 |
Source: Public Records
Map
Nearby Homes
Your Personal Tour Guide
Ask me questions while you tour the home.