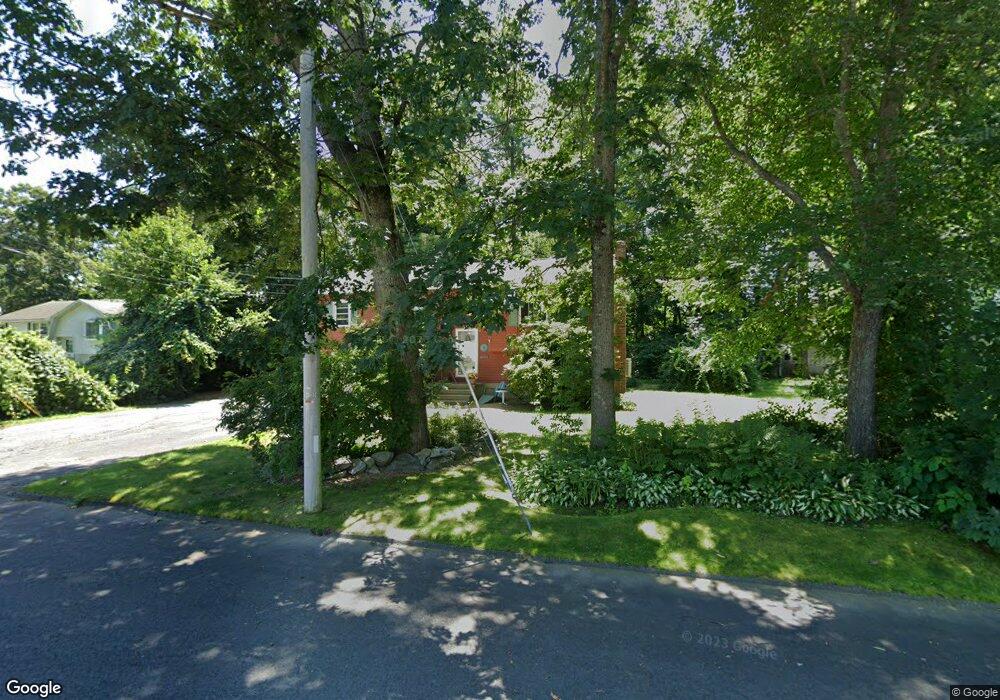
10 Grenier Ave Webster, MA 01570
Estimated Value: $333,000 - $476,000
3
Beds
2
Baths
1,831
Sq Ft
$228/Sq Ft
Est. Value
About This Home
This home is located at 10 Grenier Ave, Webster, MA 01570 and is currently estimated at $417,058, approximately $227 per square foot. 10 Grenier Ave is a home located in Worcester County with nearby schools including Park Avenue Elementary School, Webster Middle School, and Bartlett High School.
Ownership History
Date
Name
Owned For
Owner Type
Purchase Details
Closed on
Aug 2, 1995
Sold by
Didonato Pasquale
Bought by
Masiello Joel F and Masiello Lorie
Current Estimated Value
Home Financials for this Owner
Home Financials are based on the most recent Mortgage that was taken out on this home.
Original Mortgage
$114,571
Interest Rate
7.48%
Mortgage Type
Purchase Money Mortgage
Create a Home Valuation Report for This Property
The Home Valuation Report is an in-depth analysis detailing your home's value as well as a comparison with similar homes in the area
Home Values in the Area
Average Home Value in this Area
Purchase History
| Date | Buyer | Sale Price | Title Company |
|---|---|---|---|
| Masiello Joel F | $115,000 | -- |
Source: Public Records
Mortgage History
| Date | Status | Borrower | Loan Amount |
|---|---|---|---|
| Open | Masiello Joel F | $40,000 | |
| Open | Masiello Joel F | $112,500 | |
| Closed | Masiello Joel F | $114,571 |
Source: Public Records
Tax History
| Year | Tax Paid | Tax Assessment Tax Assessment Total Assessment is a certain percentage of the fair market value that is determined by local assessors to be the total taxable value of land and additions on the property. | Land | Improvement |
|---|---|---|---|---|
| 2025 | $3,786 | $318,700 | $59,300 | $259,400 |
| 2024 | $3,734 | $306,600 | $57,100 | $249,500 |
| 2023 | $3,454 | $276,300 | $54,300 | $222,000 |
| 2022 | $3,392 | $243,000 | $52,800 | $190,200 |
| 2021 | $3,404 | $225,400 | $52,800 | $172,600 |
| 2020 | $3,273 | $217,300 | $52,800 | $164,500 |
| 2019 | $3,025 | $197,300 | $52,800 | $144,500 |
| 2018 | $2,866 | $186,200 | $50,400 | $135,800 |
| 2017 | $2,734 | $180,700 | $49,300 | $131,400 |
| 2016 | $2,609 | $172,300 | $47,000 | $125,300 |
| 2015 | $2,393 | $163,000 | $46,100 | $116,900 |
Source: Public Records
Map
Nearby Homes
- 51 &52 lot Oscar Rd
- 5 Crosby St
- 00 Juniper Ln
- 36 Lake Pkwy
- 0 Carpenter Rd
- 17 Mount Pleasant St
- 404 High St
- 1 Brook St
- 7 Nipmuck Dr
- 23 Stefaniak Ave Unit 1
- 0 Thompson Rd
- 251 High St
- 0 High St
- 7 3rd Ave
- 2 Brookline St
- 13 5th Ave
- 0 Wilsonville Rd Unit 24140220
- 45 Point Pleasant Rd
- 48 Lake St
- 53-55 Point Pleasant Rd
Your Personal Tour Guide
Ask me questions while you tour the home.