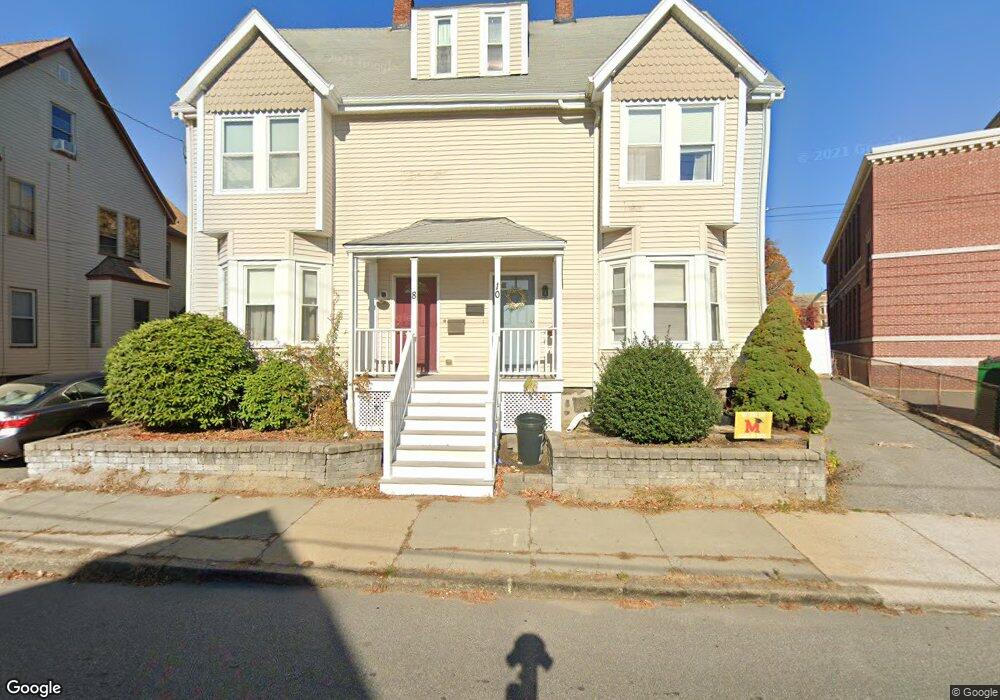
10 Grove St Melrose, MA 02176
Downtown Melrose NeighborhoodEstimated Value: $566,000 - $857,000
4
Beds
2
Baths
2,198
Sq Ft
$316/Sq Ft
Est. Value
About This Home
This home is located at 10 Grove St, Melrose, MA 02176 and is currently estimated at $694,322, approximately $315 per square foot. 10 Grove St is a home located in Middlesex County with nearby schools including Lincoln Elementary School, Winthrop Elementary School, and Roosevelt Elementary School.
Ownership History
Date
Name
Owned For
Owner Type
Purchase Details
Closed on
Feb 7, 2011
Sold by
First Horizon Home Loa
Bought by
Casazza Carly S
Current Estimated Value
Home Financials for this Owner
Home Financials are based on the most recent Mortgage that was taken out on this home.
Original Mortgage
$274,851
Outstanding Balance
$185,555
Interest Rate
4.5%
Mortgage Type
FHA
Estimated Equity
$508,767
Purchase Details
Closed on
Aug 10, 2010
Sold by
Ryan Neal J and First Horizon Home Loa
Bought by
First Horizon Home Loa and First Tennessee Bk
Purchase Details
Closed on
Nov 24, 2004
Sold by
Ryan Neal J
Bought by
Ryan Neal J
Purchase Details
Closed on
Aug 2, 2004
Sold by
Mortell Lisa and Mortell Michael C
Bought by
Ryan Neal J
Home Financials for this Owner
Home Financials are based on the most recent Mortgage that was taken out on this home.
Original Mortgage
$409,600
Interest Rate
6.33%
Mortgage Type
Purchase Money Mortgage
Create a Home Valuation Report for This Property
The Home Valuation Report is an in-depth analysis detailing your home's value as well as a comparison with similar homes in the area
Home Values in the Area
Average Home Value in this Area
Purchase History
| Date | Buyer | Sale Price | Title Company |
|---|---|---|---|
| Casazza Carly S | $282,000 | -- | |
| First Horizon Home Loa | $264,000 | -- | |
| Ryan Neal J | -- | -- | |
| Ryan Neal J | $512,000 | -- |
Source: Public Records
Mortgage History
| Date | Status | Borrower | Loan Amount |
|---|---|---|---|
| Open | Casazza Carly S | $274,851 | |
| Previous Owner | Ryan Neal J | $409,600 |
Source: Public Records
Tax History Compared to Growth
Tax History
| Year | Tax Paid | Tax Assessment Tax Assessment Total Assessment is a certain percentage of the fair market value that is determined by local assessors to be the total taxable value of land and additions on the property. | Land | Improvement |
|---|---|---|---|---|
| 2025 | $44 | $447,200 | $0 | $447,200 |
| 2024 | $4,391 | $442,200 | $0 | $442,200 |
| 2023 | $4,474 | $429,400 | $0 | $429,400 |
| 2022 | $4,351 | $411,600 | $0 | $411,600 |
| 2021 | $4,367 | $398,800 | $0 | $398,800 |
| 2020 | $4,407 | $398,800 | $0 | $398,800 |
| 2019 | $4,035 | $373,300 | $0 | $373,300 |
| 2018 | $3,883 | $342,700 | $0 | $342,700 |
| 2017 | $3,894 | $330,000 | $0 | $330,000 |
| 2016 | $3,694 | $299,600 | $0 | $299,600 |
| 2015 | $3,883 | $299,600 | $0 | $299,600 |
| 2014 | $3,843 | $289,400 | $0 | $289,400 |
Source: Public Records
Map
Nearby Homes
- 20 Herbert St
- 333 Main St
- 36 Waverly Place Unit 2
- 12 Mount Vernon St Unit 27
- 16 Willow St Unit 207
- 23 Waverly Place
- 447 Pleasant St
- 407 Pleasant St Unit 1A
- 16-18 Beacon Place
- 58 Summer St
- 244 Main St
- 16 Baxter St
- 236-238 Main St
- 22 Adams St
- 9 Crescent Ave
- 12 Sylvan St Unit 4
- 12 Sylvan St Unit 3
- 161 Washington St
- 8 Crystal St Unit 3
- 8 Crystal St Unit 2
- 8 Grove St
- 8 Grove St Unit 1
- 5 Allen Place
- 4 Grove St
- 7 Allen Place
- 7 Allen Place Unit 1
- 3 Allen Place
- 9 Grove St
- 1 Allen Place
- 15 Grove St
- 15 Grove St Unit 2
- 5 Grove St
- 45 Berwick St
- 37-47 Berwick St
- 11 Grove St Unit 11A
- 11 Grove St Unit 1
- 6 Allen Place
- 39 Berwick St Unit 2L
- 39 Berwick St Unit 3R
- 4 Allen Place