10 Hale St Brockton, MA 02302
Estimated Value: $440,000 - $488,040
3
Beds
1
Bath
1,306
Sq Ft
$359/Sq Ft
Est. Value
About This Home
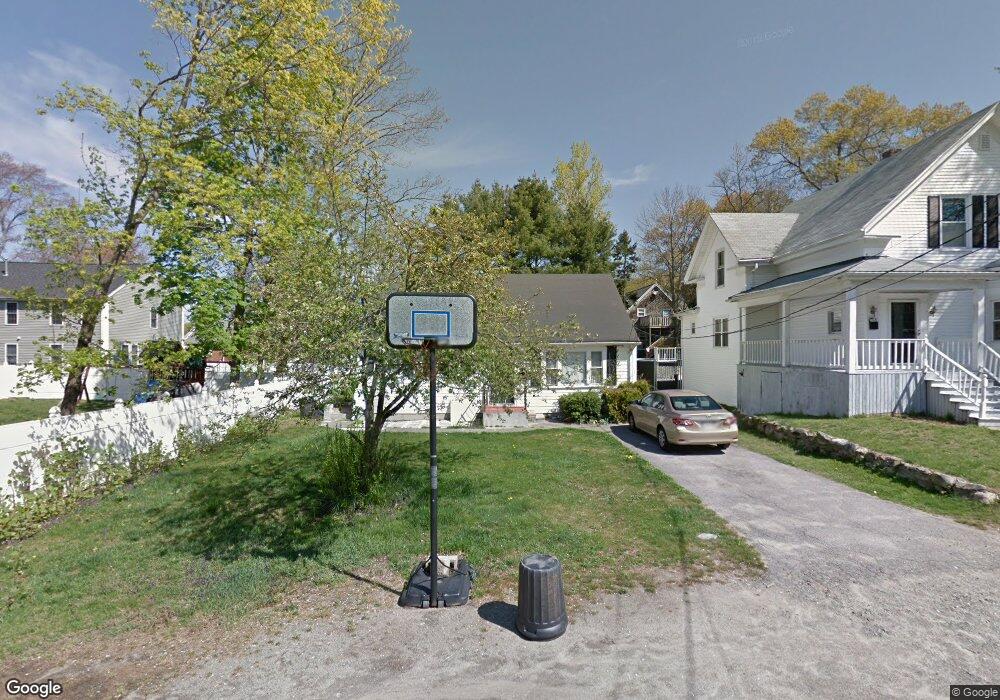
This home is located at 10 Hale St, Brockton, MA 02302 and is currently estimated at $469,260, approximately $359 per square foot. 10 Hale St is a home located in Plymouth County with nearby schools including Brookfield Elementary School, Downey Elementary School, and Ashfield Middle School.
Ownership History
Date
Name
Owned For
Owner Type
Purchase Details
Closed on
Sep 26, 2020
Sold by
Forbes Carine
Bought by
Carine Forbes Ret
Current Estimated Value
Purchase Details
Closed on
Sep 28, 2007
Sold by
Forbes Robert J
Bought by
Forbes Carine
Purchase Details
Closed on
Jul 14, 1992
Sold by
Fillmore Ronald L and Cilibrasi Patricia
Bought by
Forbes Robert J and Forbes Carine
Home Financials for this Owner
Home Financials are based on the most recent Mortgage that was taken out on this home.
Original Mortgage
$81,000
Interest Rate
8.56%
Mortgage Type
Purchase Money Mortgage
Create a Home Valuation Report for This Property
The Home Valuation Report is an in-depth analysis detailing your home's value as well as a comparison with similar homes in the area
Home Values in the Area
Average Home Value in this Area
Purchase History
| Date | Buyer | Sale Price | Title Company |
|---|---|---|---|
| Carine Forbes Ret | -- | None Available | |
| Forbes Carine | -- | -- | |
| Forbes Robert J | $90,000 | -- |
Source: Public Records
Mortgage History
| Date | Status | Borrower | Loan Amount |
|---|---|---|---|
| Previous Owner | Forbes Robert J | $78,250 | |
| Previous Owner | Forbes Robert J | $81,000 |
Source: Public Records
Tax History Compared to Growth
Tax History
| Year | Tax Paid | Tax Assessment Tax Assessment Total Assessment is a certain percentage of the fair market value that is determined by local assessors to be the total taxable value of land and additions on the property. | Land | Improvement |
|---|---|---|---|---|
| 2025 | $5,090 | $420,300 | $140,000 | $280,300 |
| 2024 | $4,860 | $404,300 | $140,000 | $264,300 |
| 2023 | $4,921 | $379,100 | $104,100 | $275,000 |
| 2022 | $4,173 | $298,700 | $94,600 | $204,100 |
| 2021 | $4,212 | $290,500 | $78,600 | $211,900 |
| 2020 | $3,856 | $254,500 | $73,600 | $180,900 |
| 2019 | $3,896 | $250,700 | $71,800 | $178,900 |
| 2018 | $3,474 | $216,300 | $71,800 | $144,500 |
| 2017 | $2,977 | $184,900 | $71,800 | $113,100 |
| 2016 | $3,286 | $189,300 | $69,600 | $119,700 |
| 2015 | $2,951 | $162,600 | $69,600 | $93,000 |
| 2014 | $3,106 | $171,300 | $69,600 | $101,700 |
Source: Public Records
Map
Nearby Homes