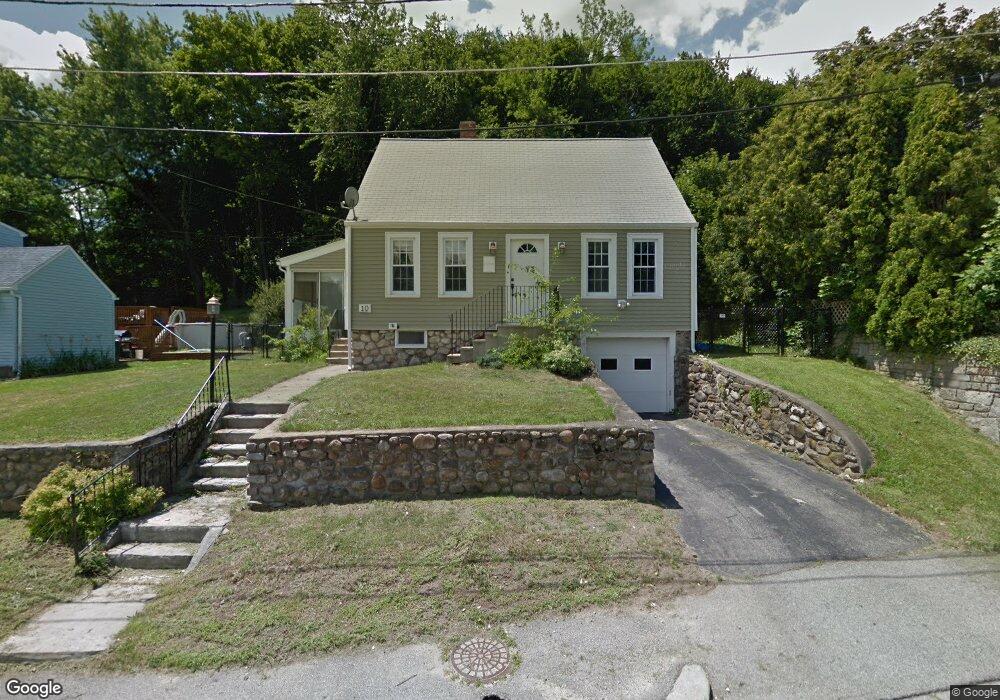
10 Harwich St Worcester, MA 01607
South Quinsigamond Village NeighborhoodEstimated Value: $392,486 - $421,000
3
Beds
1
Bath
1,215
Sq Ft
$333/Sq Ft
Est. Value
About This Home
This home is located at 10 Harwich St, Worcester, MA 01607 and is currently estimated at $404,122, approximately $332 per square foot. 10 Harwich St is a home located in Worcester County with nearby schools including Quinsigamond School, Jacob Hiatt Magnet School, and Chandler Magnet.
Ownership History
Date
Name
Owned For
Owner Type
Purchase Details
Closed on
May 26, 2006
Sold by
Peculis John T and Olson Melanie L
Bought by
Tagg Matthew F
Current Estimated Value
Home Financials for this Owner
Home Financials are based on the most recent Mortgage that was taken out on this home.
Original Mortgage
$188,000
Outstanding Balance
$110,281
Interest Rate
6.53%
Mortgage Type
Purchase Money Mortgage
Estimated Equity
$293,841
Purchase Details
Closed on
Oct 15, 2003
Sold by
Est Kellstrand Eric A and Olson Stephen S
Bought by
Peculis John T and Olson Melanie L
Home Financials for this Owner
Home Financials are based on the most recent Mortgage that was taken out on this home.
Original Mortgage
$158,595
Interest Rate
6.43%
Mortgage Type
Purchase Money Mortgage
Create a Home Valuation Report for This Property
The Home Valuation Report is an in-depth analysis detailing your home's value as well as a comparison with similar homes in the area
Home Values in the Area
Average Home Value in this Area
Purchase History
| Date | Buyer | Sale Price | Title Company |
|---|---|---|---|
| Tagg Matthew F | $235,000 | -- | |
| Peculis John T | $163,500 | -- |
Source: Public Records
Mortgage History
| Date | Status | Borrower | Loan Amount |
|---|---|---|---|
| Open | Tagg Matthew F | $188,000 | |
| Previous Owner | Peculis John T | $158,595 |
Source: Public Records
Tax History
| Year | Tax Paid | Tax Assessment Tax Assessment Total Assessment is a certain percentage of the fair market value that is determined by local assessors to be the total taxable value of land and additions on the property. | Land | Improvement |
|---|---|---|---|---|
| 2025 | $4,623 | $350,500 | $115,000 | $235,500 |
| 2024 | $4,536 | $329,900 | $115,000 | $214,900 |
| 2023 | $4,342 | $302,800 | $100,000 | $202,800 |
| 2022 | $3,971 | $261,100 | $80,000 | $181,100 |
| 2021 | $3,712 | $228,000 | $64,000 | $164,000 |
| 2020 | $3,621 | $213,000 | $64,000 | $149,000 |
| 2019 | $3,443 | $191,300 | $57,600 | $133,700 |
| 2018 | $3,459 | $182,900 | $57,600 | $125,300 |
| 2017 | $3,315 | $172,500 | $57,600 | $114,900 |
| 2016 | $3,240 | $157,200 | $42,300 | $114,900 |
| 2015 | $3,155 | $157,200 | $42,300 | $114,900 |
| 2014 | $3,072 | $157,200 | $42,300 | $114,900 |
Source: Public Records
Map
Nearby Homes
- 29 Steele St
- 49 Strasburg Rd
- 4 Stockholm St
- 30 Ekman St
- 22 Bittersweet Blvd
- 6 Beckman St
- 50 Whipple St
- 50 Sophia Dr
- 73 Sophia Dr
- 6 Epworth St
- 47 Gibbs St
- 557 SW Cutoff Unit 17
- 557 SW Cutoff Unit 55
- 557 SW Cutoff Unit 60
- 154 Pakachoag St
- 464-466 Granite St
- 460-462 Granite St
- 460-466 Granite St
- 457 Granite St
- 3 Payson St
Your Personal Tour Guide
Ask me questions while you tour the home.