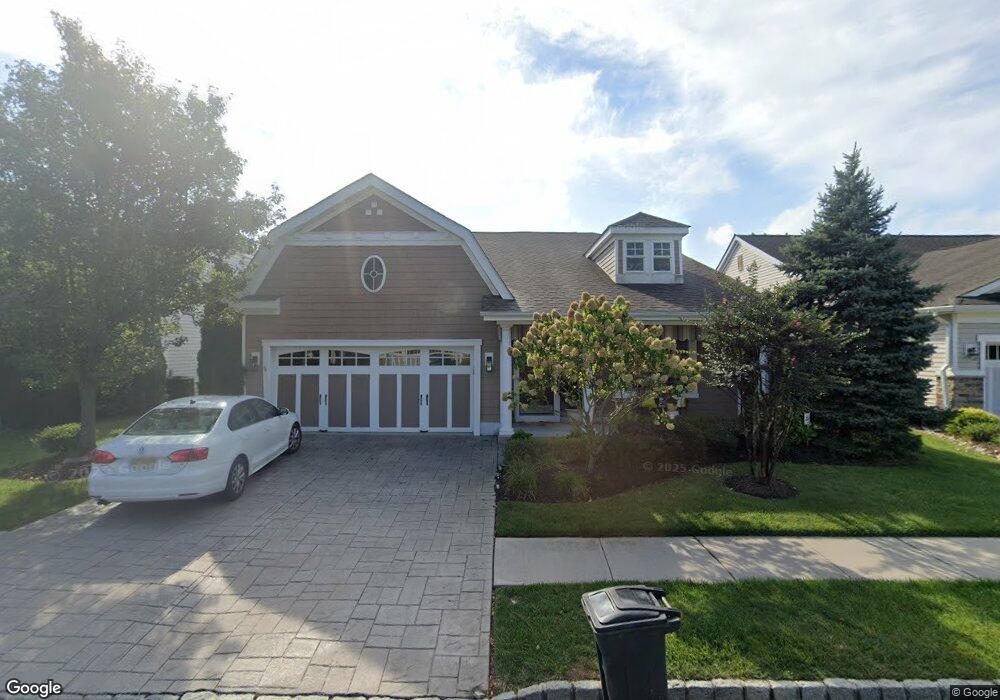
10 Haskell Way Oceanport, NJ 07757
Estimated Value: $953,438 - $1,088,000
3
Beds
1
Bath
2,340
Sq Ft
$438/Sq Ft
Est. Value
About This Home
This home is located at 10 Haskell Way, Oceanport, NJ 07757 and is currently estimated at $1,025,860, approximately $438 per square foot. 10 Haskell Way is a home with nearby schools including Wolf Hill Elementary School, Maple Place Elementary and Middle School, and Shore Regional High School.
Ownership History
Date
Name
Owned For
Owner Type
Purchase Details
Closed on
Aug 10, 2020
Sold by
Migliaccio Holly
Bought by
Union Street Partners Llc
Current Estimated Value
Purchase Details
Closed on
Jul 13, 2017
Sold by
Sergeant Gary P and Sergeant Brad R
Bought by
Migliaccio Holly
Purchase Details
Closed on
Aug 13, 2013
Sold by
Sergeant Doris
Bought by
Sergeant Gary P and Sergeant Brad R
Create a Home Valuation Report for This Property
The Home Valuation Report is an in-depth analysis detailing your home's value as well as a comparison with similar homes in the area
Home Values in the Area
Average Home Value in this Area
Purchase History
| Date | Buyer | Sale Price | Title Company |
|---|---|---|---|
| Union Street Partners Llc | -- | Foundation Title Llc | |
| Migliaccio Holly | $562,781 | None Available | |
| Sergeant Gary P | -- | None Available |
Source: Public Records
Tax History
| Year | Tax Paid | Tax Assessment Tax Assessment Total Assessment is a certain percentage of the fair market value that is determined by local assessors to be the total taxable value of land and additions on the property. | Land | Improvement |
|---|---|---|---|---|
| 2025 | $12,591 | $881,600 | $420,200 | $461,400 |
| 2024 | $12,603 | $797,400 | $400,200 | $397,200 |
| 2023 | $12,603 | $757,400 | $375,200 | $382,200 |
| 2022 | $8,609 | $660,900 | $320,200 | $340,700 |
| 2021 | $8,609 | $616,300 | $288,200 | $328,100 |
| 2020 | $10,816 | $591,700 | $265,200 | $326,500 |
| 2019 | $10,520 | $584,100 | $265,200 | $318,900 |
| 2018 | $10,450 | $584,100 | $265,200 | $318,900 |
| 2017 | $11,631 | $539,200 | $225,200 | $314,000 |
| 2016 | $11,508 | $537,000 | $225,200 | $311,800 |
| 2015 | $11,050 | $532,800 | $225,200 | $307,600 |
| 2014 | $10,391 | $508,100 | $225,200 | $282,900 |
Source: Public Records
Map
Nearby Homes
- 14 Oceanport Ave
- 66 Pemberton Ave
- 37 Steeplechase Ct
- 15 Maple Ave
- 0 Elkwood Ave
- 28 Fairfield Ave
- 265 Port Au Peck Ave
- 35 Avon Ave
- 24 Burntmill Cir
- 11 Avon Ave
- 10 Asbury Ave
- 25 Monmouth Rd Unit 2
- 13 Saratoga
- 58 Monmouth Rd
- 8 Hialeah
- 12 Balmer Ct
- 10 Sunset Rd
- 1 Foggia Way
- 3 Sandbar Aly
- 448 Branchport Ave
Your Personal Tour Guide
Ask me questions while you tour the home.