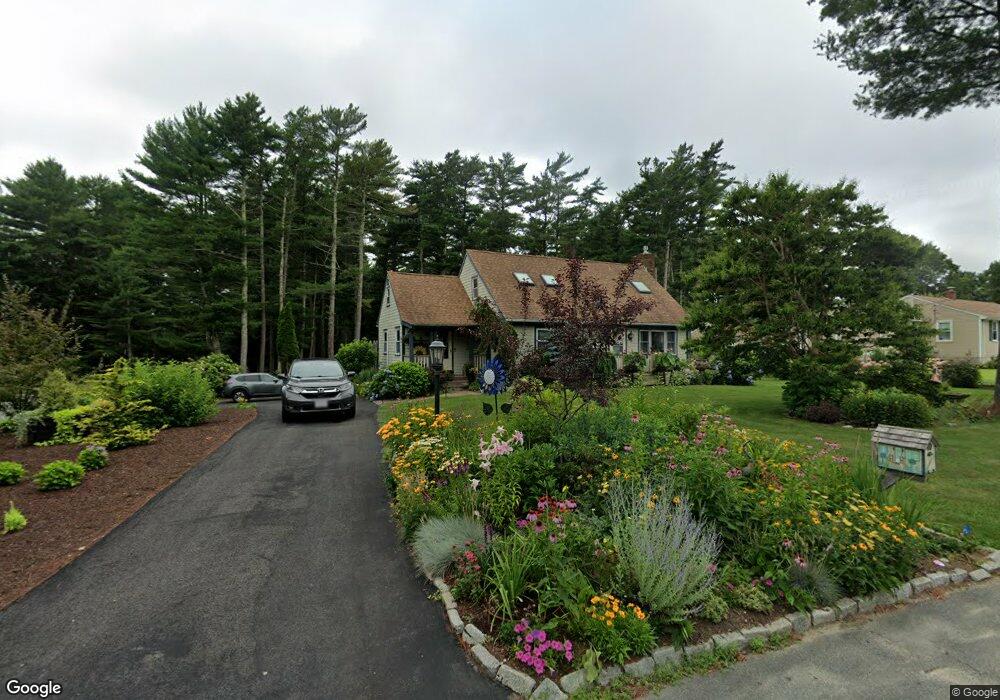
10 Hayes St East Freetown, MA 02717
Estimated Value: $634,402
3
Beds
3
Baths
1,918
Sq Ft
$331/Sq Ft
Est. Value
About This Home
This home is located at 10 Hayes St, East Freetown, MA 02717 and is currently estimated at $634,402, approximately $330 per square foot. 10 Hayes St is a home located in Bristol County with nearby schools including Freetown Elementary School, George R Austin Intermediate School, and Freetown-Lakeville Middle School.
Ownership History
Date
Name
Owned For
Owner Type
Purchase Details
Closed on
Aug 5, 2016
Sold by
Poitras Donald D and Poitras Rita
Bought by
Poitras Ft
Current Estimated Value
Purchase Details
Closed on
Nov 24, 1997
Sold by
Munroe Robert J and Munroe Carol A
Bought by
Poitras Donald D and Poitras Rita
Create a Home Valuation Report for This Property
The Home Valuation Report is an in-depth analysis detailing your home's value as well as a comparison with similar homes in the area
Home Values in the Area
Average Home Value in this Area
Purchase History
| Date | Buyer | Sale Price | Title Company |
|---|---|---|---|
| Poitras Ft | -- | -- | |
| Poitras Donald D | $143,000 | -- |
Source: Public Records
Mortgage History
| Date | Status | Borrower | Loan Amount |
|---|---|---|---|
| Previous Owner | Poitras Donald D | $127,000 | |
| Previous Owner | Poitras Donald D | $193,000 |
Source: Public Records
Tax History Compared to Growth
Tax History
| Year | Tax Paid | Tax Assessment Tax Assessment Total Assessment is a certain percentage of the fair market value that is determined by local assessors to be the total taxable value of land and additions on the property. | Land | Improvement |
|---|---|---|---|---|
| 2025 | $0 | $466,400 | $176,000 | $290,400 |
| 2024 | $3,867 | $440,400 | $166,100 | $274,300 |
| 2023 | $0 | $415,800 | $149,600 | $266,200 |
| 2022 | $3,867 | $399,000 | $126,700 | $272,300 |
| 2021 | $4,810 | $343,000 | $115,200 | $227,800 |
| 2020 | $4,714 | $331,200 | $110,800 | $220,400 |
| 2019 | $4,040 | $312,200 | $105,500 | $206,700 |
| 2018 | $3,867 | $290,500 | $105,500 | $185,000 |
| 2017 | $3,300 | $281,900 | $105,500 | $176,400 |
| 2016 | $3,613 | $276,000 | $102,500 | $173,500 |
| 2015 | $3,518 | $272,700 | $102,500 | $170,200 |
| 2014 | $3,369 | $267,200 | $100,400 | $166,800 |
Source: Public Records
Map
Nearby Homes
- 3 Abraham Ave
- 247 Braley Hill Rd
- 269 Middleboro Rd
- 28 Cedar Hill Dr
- 9 Paul Ave
- 714 Snipatuit Rd
- 120 Hackett Ave
- 60 Lakeside Ave
- 21 Bennett Rd
- 168 Keene Rd
- 199 Quaker Ln
- 4597 Acushnet Ave
- 0 Keene Rd Unit 73459818
- 562 North Ave
- 319 Northwest St
- 15 Morrison Way
- 0 Costa Dr
- 353 Upland St
- 21 Robinson Rd
- 7 2nd Ave