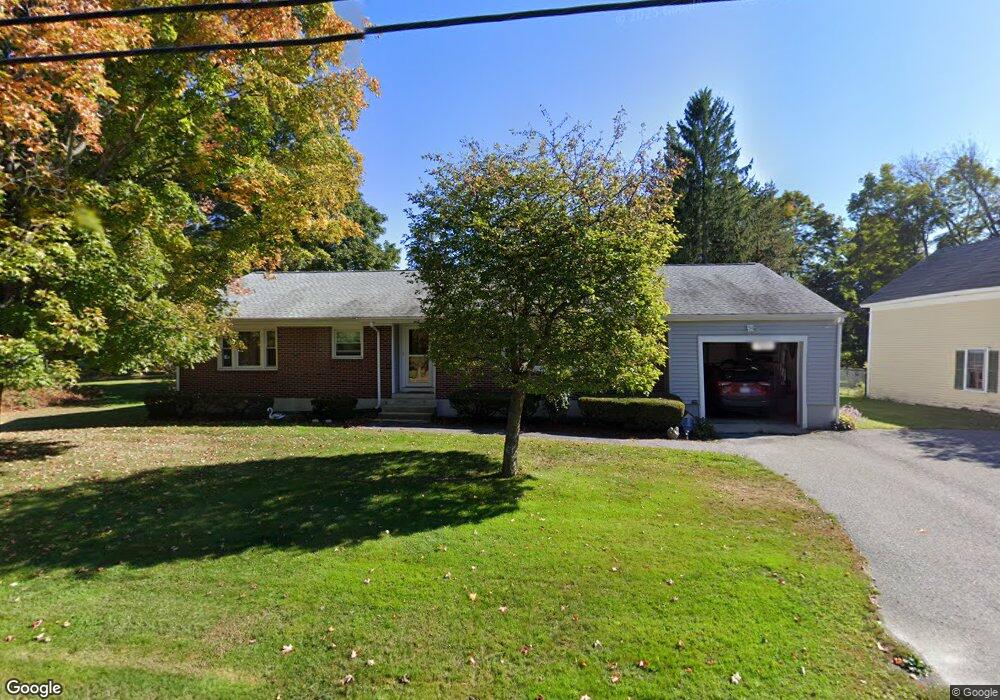
10 Heald St Pepperell, MA 01463
Estimated Value: $468,000 - $499,000
3
Beds
1
Bath
1,590
Sq Ft
$302/Sq Ft
Est. Value
About This Home
This home is located at 10 Heald St, Pepperell, MA 01463 and is currently estimated at $480,208, approximately $302 per square foot. 10 Heald St is a home located in Middlesex County with nearby schools including North Middlesex Regional High School, Pepperell Christian Academy, and Maple Dene & Moppet School.
Ownership History
Date
Name
Owned For
Owner Type
Purchase Details
Closed on
Oct 29, 2021
Sold by
Morton Robert J and Morton Lisa M
Bought by
Morton Colby J
Current Estimated Value
Purchase Details
Closed on
Oct 22, 2008
Sold by
Morton Robert J
Bought by
Morton Lisa M and Morton Robert J
Home Financials for this Owner
Home Financials are based on the most recent Mortgage that was taken out on this home.
Original Mortgage
$50,000
Interest Rate
5.94%
Create a Home Valuation Report for This Property
The Home Valuation Report is an in-depth analysis detailing your home's value as well as a comparison with similar homes in the area
Home Values in the Area
Average Home Value in this Area
Purchase History
| Date | Buyer | Sale Price | Title Company |
|---|---|---|---|
| Morton Colby J | $75,000 | None Available | |
| Morton Lisa M | -- | -- | |
| Morton Robert J | $100,000 | -- |
Source: Public Records
Mortgage History
| Date | Status | Borrower | Loan Amount |
|---|---|---|---|
| Previous Owner | Morton Robert J | $50,000 |
Source: Public Records
Tax History Compared to Growth
Tax History
| Year | Tax Paid | Tax Assessment Tax Assessment Total Assessment is a certain percentage of the fair market value that is determined by local assessors to be the total taxable value of land and additions on the property. | Land | Improvement |
|---|---|---|---|---|
| 2025 | $5,969 | $408,000 | $141,900 | $266,100 |
| 2024 | $5,615 | $391,300 | $129,500 | $261,800 |
| 2023 | $5,609 | $370,500 | $117,200 | $253,300 |
| 2022 | $5,119 | $298,500 | $104,900 | $193,600 |
| 2021 | $4,957 | $276,600 | $92,500 | $184,100 |
| 2020 | $4,697 | $276,600 | $92,500 | $184,100 |
| 2019 | $4,396 | $265,000 | $92,500 | $172,500 |
| 2018 | $4,084 | $249,200 | $92,500 | $156,700 |
| 2017 | $3,755 | $236,300 | $86,400 | $149,900 |
| 2016 | $3,427 | $207,300 | $86,400 | $120,900 |
| 2015 | $3,150 | $197,500 | $86,400 | $111,100 |
| 2014 | $2,948 | $185,900 | $86,400 | $99,500 |
Source: Public Records
Map
Nearby Homes
- 7 Elm St
- 16 Village Rd
- 25 Chace Ave
- 6 Mason St Unit 59
- 19 Sartelle St
- 17 Chace Ave
- 12 Chace Ave
- 22 River Rd
- 10 Tucker St
- 103 Main St Unit 23
- 38 River Rd Unit 11
- 46 Brookline St
- 8 Tucker Park Unit D
- 3 Nashua Rd
- 97 Park St
- 18 Maple St
- 35 Mount Lebanon St
- 7 Birch Hill Rd
- 2 Old Farm Ln
- 7 Blue Herons Way
- 12 Heald St
- 11 Townsend St
- 9 Townsend St
- 11 Heald St
- 9 Heald St Unit 11
- 7 Townsend St
- 7 Townsend St Unit A
- 7 Townsend St Unit A (Front)
- 5 Heald St
- 16 Heald St
- 19 Townsend St
- 12 Townsend St
- 14 Townsend St
- 10 Townsend St
- 16 Townsend St
- 6 Townsend St
- 7 Heald St
- 4 Townsend St
- 18 Townsend St
- 21-27 Townsend St