Estimated Value: $213,090 - $250,000
--
Bed
--
Bath
1,678
Sq Ft
$140/Sq Ft
Est. Value
About This Home
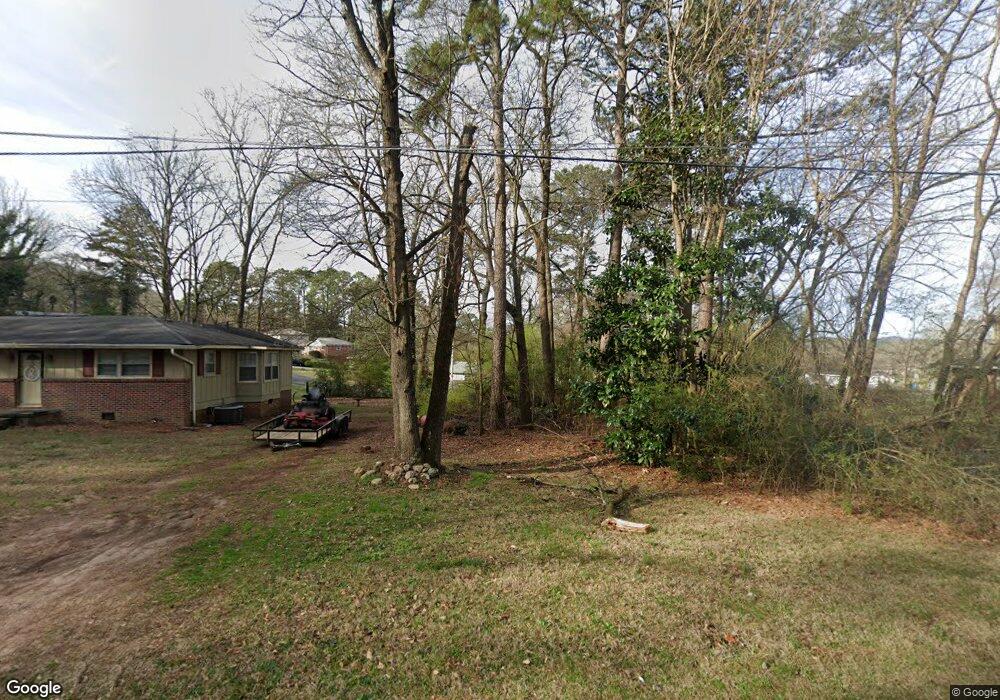
This home is located at 10 Helen St SE, Rome, GA 30161 and is currently estimated at $234,523, approximately $139 per square foot. 10 Helen St SE is a home located in Floyd County with nearby schools including Pepperell Middle School, Pepperell High School, and Montessori School of Rome.
Ownership History
Date
Name
Owned For
Owner Type
Purchase Details
Closed on
Apr 8, 2022
Sold by
Pence Franklin B
Bought by
Pence Franklin B and Pence Bethany Lee
Current Estimated Value
Home Financials for this Owner
Home Financials are based on the most recent Mortgage that was taken out on this home.
Original Mortgage
$139,918
Interest Rate
3.89%
Mortgage Type
FHA
Purchase Details
Closed on
Apr 26, 2017
Sold by
Flynn Judy E
Bought by
Daniel
Purchase Details
Closed on
Nov 25, 2009
Sold by
Kinney Mary Helen
Bought by
Flynn Judy E
Purchase Details
Closed on
Nov 28, 2006
Sold by
Not Provided
Bought by
Flynn Judy E and Flynn Larry Kinney
Purchase Details
Closed on
Nov 9, 2000
Bought by
P and R
Purchase Details
Closed on
Apr 23, 1986
Bought by
P and R
Purchase Details
Closed on
Jan 18, 1960
Bought by
Kinney Robert L and Kinney Mary
Create a Home Valuation Report for This Property
The Home Valuation Report is an in-depth analysis detailing your home's value as well as a comparison with similar homes in the area
Home Values in the Area
Average Home Value in this Area
Purchase History
| Date | Buyer | Sale Price | Title Company |
|---|---|---|---|
| Pence Franklin B | -- | -- | |
| Kinney Robert Larry | $71,300 | -- | |
| Pence Franklin B | $71,200 | -- | |
| Daniel | -- | -- | |
| Flynn Judy E | -- | -- | |
| Flynn Judy E | -- | -- | |
| P | $1,000 | -- | |
| P | -- | -- | |
| Kinney Robert L | -- | -- |
Source: Public Records
Mortgage History
| Date | Status | Borrower | Loan Amount |
|---|---|---|---|
| Previous Owner | Pence Franklin B | $139,918 |
Source: Public Records
Tax History Compared to Growth
Tax History
| Year | Tax Paid | Tax Assessment Tax Assessment Total Assessment is a certain percentage of the fair market value that is determined by local assessors to be the total taxable value of land and additions on the property. | Land | Improvement |
|---|---|---|---|---|
| 2024 | $2,984 | $92,723 | $17,280 | $75,443 |
| 2023 | $2,757 | $87,762 | $15,360 | $72,402 |
| 2022 | $2,300 | $73,949 | $12,800 | $61,149 |
| 2021 | $1,849 | $57,878 | $8,588 | $49,290 |
| 2020 | $1,720 | $53,302 | $6,441 | $46,861 |
| 2019 | $1,454 | $45,397 | $6,441 | $38,956 |
| 2018 | $1,391 | $43,311 | $6,441 | $36,870 |
| 2017 | $1,322 | $40,951 | $6,441 | $34,510 |
| 2016 | $1,384 | $42,440 | $6,400 | $36,040 |
| 2015 | $1,400 | $42,480 | $6,400 | $36,080 |
| 2014 | $1,400 | $43,877 | $6,400 | $37,477 |
Source: Public Records
Map
Nearby Homes
- 2107 Rockmart Rd SE
- 107 E Linden St SE
- 2501 Maple Rd SE
- 7 Willingham St SW
- 2508 Maple Rd SE
- 2108 Maple Ave SW
- 111 Hosea St SW
- 14 Clover St SW
- 2523 Maple Rd SE
- 119 Chateau Dr SE
- 113 Chateau Dr SE
- 93 Chateau Dr SE
- 85 Chateau Dr SE
- 79 Chateau Dr SE
- 81 Chateau Dr SE
- 211 Alfred Ave SE
- 2014 Maple Ave SW
- 3 Belmont Ct SE
- 15 Saddlebrook Dr SE
- 105 Chateau Dr SE
- 7 Rosemont Dr SE
- 0 Rosemont Dr SE Unit 7355732
- 12 Helen St SE
- 9 Rosemont Dr SE
- 4 Rosemont Dr SE
- 0 Helen St
- 6 Rosemont Dr SE
- 11 Rosemont Dr SE
- 6 Helen St SE
- 6 Helen St SE
- 2 Rosemont Dr SE
- 8 Rosemont Dr SE
- 6 Helen St
- 11 Helen St SE
- 10 Rosemont Dr SE
- 9 Helen St SE
- 4 Helen St SE
- 13 Rosemont Dr SE
- 2405 Flannery St SE
- 2403 Flannery St SE