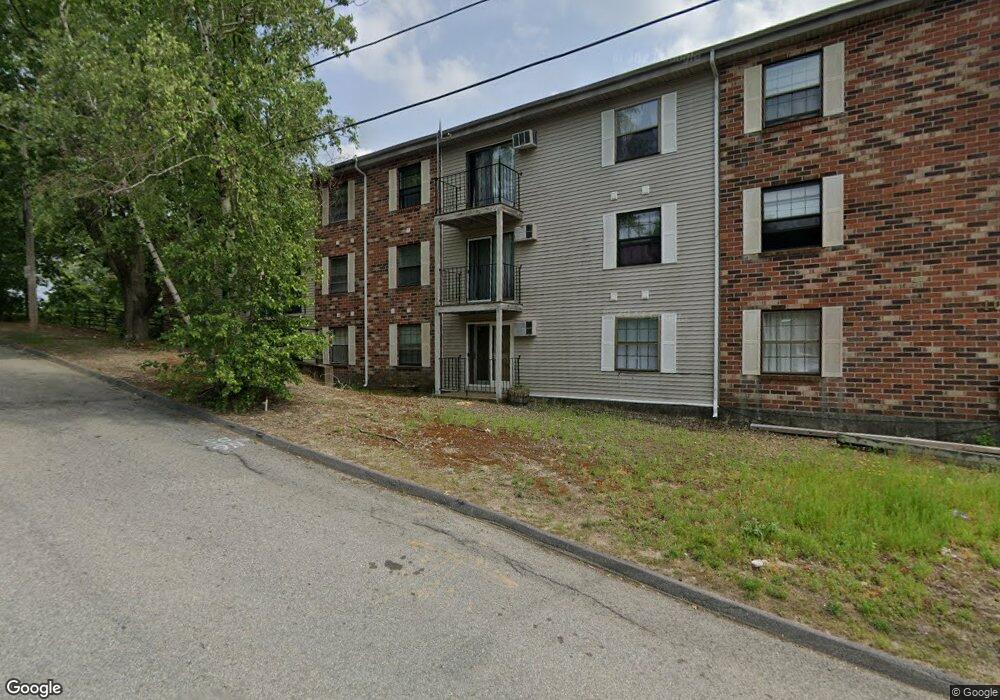
10 Hemans St Unit 4 Worcester, MA 01605
Indian Lake East NeighborhoodEstimated Value: $177,000 - $233,000
1
Bed
1
Bath
709
Sq Ft
$299/Sq Ft
Est. Value
About This Home
This home is located at 10 Hemans St Unit 4, Worcester, MA 01605 and is currently estimated at $211,739, approximately $298 per square foot. 10 Hemans St Unit 4 is a home located in Worcester County with nearby schools including Francis J. McGrath Elementary School, Jacob Hiatt Magnet School, and Chandler Magnet.
Ownership History
Date
Name
Owned For
Owner Type
Purchase Details
Closed on
Jun 29, 2017
Sold by
Bahnassi Hanan and Bahnassi Amjad
Bought by
Bawabiji Maissaa
Current Estimated Value
Purchase Details
Closed on
Dec 9, 2016
Sold by
Deutsche Bk Natl T Co
Bought by
Bahnassi Hanan
Purchase Details
Closed on
Jul 5, 2016
Sold by
Nkwenti Victor
Bought by
Deutsche Bk Natl T Co
Purchase Details
Closed on
Aug 31, 2005
Sold by
Oliver 10-4 Heman Rt and Oliver Sally I
Bought by
Nkwenti Victor N
Home Financials for this Owner
Home Financials are based on the most recent Mortgage that was taken out on this home.
Original Mortgage
$77,900
Interest Rate
5.81%
Mortgage Type
Purchase Money Mortgage
Purchase Details
Closed on
May 27, 1988
Sold by
Rr Rw Sears Rt
Bought by
Oliver Donald M
Home Financials for this Owner
Home Financials are based on the most recent Mortgage that was taken out on this home.
Original Mortgage
$58,400
Interest Rate
10.18%
Mortgage Type
Purchase Money Mortgage
Create a Home Valuation Report for This Property
The Home Valuation Report is an in-depth analysis detailing your home's value as well as a comparison with similar homes in the area
Home Values in the Area
Average Home Value in this Area
Purchase History
| Date | Buyer | Sale Price | Title Company |
|---|---|---|---|
| Bawabiji Maissaa | $69,500 | -- | |
| Bahnassi Hanan | $48,000 | -- | |
| Deutsche Bk Natl T Co | $71,000 | -- | |
| Nkwenti Victor N | $77,900 | -- | |
| Oliver Donald M | $64,900 | -- |
Source: Public Records
Mortgage History
| Date | Status | Borrower | Loan Amount |
|---|---|---|---|
| Previous Owner | Nkwenti Victor N | $77,900 | |
| Previous Owner | Oliver Donald M | $58,400 |
Source: Public Records
Tax History Compared to Growth
Tax History
| Year | Tax Paid | Tax Assessment Tax Assessment Total Assessment is a certain percentage of the fair market value that is determined by local assessors to be the total taxable value of land and additions on the property. | Land | Improvement |
|---|---|---|---|---|
| 2025 | $2,606 | $197,600 | $0 | $197,600 |
| 2024 | $2,490 | $181,100 | $0 | $181,100 |
| 2023 | $1,547 | $107,900 | $0 | $107,900 |
| 2022 | $1,410 | $92,700 | $0 | $92,700 |
| 2021 | $1,221 | $75,000 | $0 | $75,000 |
| 2020 | $1,114 | $65,500 | $0 | $65,500 |
| 2019 | $1,157 | $64,300 | $0 | $64,300 |
| 2018 | $1,135 | $60,000 | $0 | $60,000 |
| 2017 | $1,130 | $58,800 | $0 | $58,800 |
| 2016 | $1,212 | $58,800 | $0 | $58,800 |
| 2015 | $1,180 | $58,800 | $0 | $58,800 |
| 2014 | $1,170 | $59,900 | $0 | $59,900 |
Source: Public Records
Map
Nearby Homes
- 10 Dryden St Unit 7
- 23 Dryden St
- 63 North St Unit A
- 63 North St Unit B
- 6 Milton St
- 11 Gifford Dr
- 65 Paine St
- 89 W Boylston St Unit 4
- 176 Lincoln St Unit 4
- 12 Alexander Rd
- 23 Ashton St
- 74 Green Hill Pkwy
- 139 Lincoln St
- 78 Green Hill Pkwy
- 15 Boardman St
- 82 Green Hill Pkwy
- 41 Westminster St
- 19 Mckinley Rd
- 80 Salisbury St Unit 206
- 44 Westminster St
- 10 Hemans St Unit 24
- 10 Hemans St Unit 23
- 10 Hemans St Unit 22
- 10 Hemans St Unit 21
- 10 Hemans St Unit 20
- 10 Hemans St Unit 19
- 10 Hemans St Unit 18
- 10 Hemans St Unit 17
- 10 Hemans St Unit 16
- 10 Hemans St Unit 15
- 10 Hemans St Unit 14
- 10 Hemans St Unit 12
- 10 Hemans St Unit 11
- 10 Hemans St
- 10 Hemans St Unit 8
- 10 Hemans St Unit 7
- 10 Hemans St Unit 6
- 10 Hemans St Unit 5
- 10 Hemans St Unit 3
- 10 Hemans St Unit 2