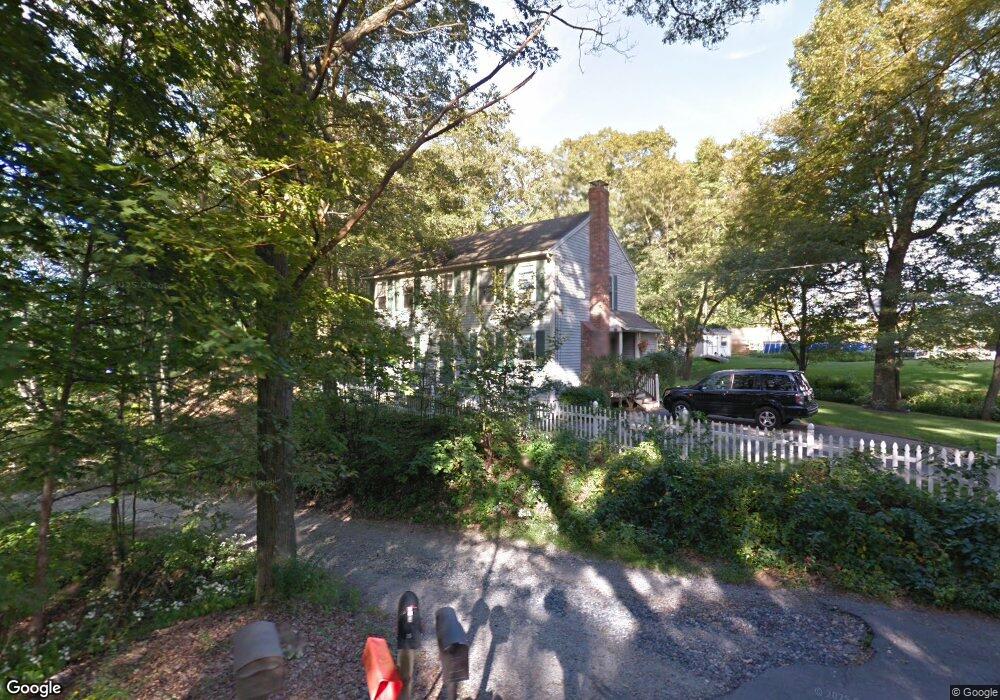
10 Hemlock Rd Wrentham, MA 02093
Estimated Value: $589,000 - $678,000
3
Beds
3
Baths
1,871
Sq Ft
$333/Sq Ft
Est. Value
About This Home
This home is located at 10 Hemlock Rd, Wrentham, MA 02093 and is currently estimated at $622,145, approximately $332 per square foot. 10 Hemlock Rd is a home located in Norfolk County with nearby schools including Delaney Elementary School and Charles E Roderick.
Ownership History
Date
Name
Owned For
Owner Type
Purchase Details
Closed on
Jul 23, 2007
Sold by
Mahoney Erin T and Mahoney Francis C
Bought by
Roach Kevin P and Garvey Shannon M
Current Estimated Value
Home Financials for this Owner
Home Financials are based on the most recent Mortgage that was taken out on this home.
Original Mortgage
$256,875
Outstanding Balance
$160,891
Interest Rate
6.54%
Mortgage Type
Purchase Money Mortgage
Estimated Equity
$461,254
Purchase Details
Closed on
Jul 15, 1994
Sold by
Dauksewich James P and Dauksewich Donna M
Bought by
Mahoney Francis C and Mahoney Erin T
Home Financials for this Owner
Home Financials are based on the most recent Mortgage that was taken out on this home.
Original Mortgage
$138,600
Interest Rate
8.51%
Mortgage Type
Purchase Money Mortgage
Purchase Details
Closed on
Jun 15, 1990
Sold by
Lorusso Brothers Inc
Bought by
Dauksewich James P
Create a Home Valuation Report for This Property
The Home Valuation Report is an in-depth analysis detailing your home's value as well as a comparison with similar homes in the area
Purchase History
We collect this data history from publicly available records. To have your information removed, we recommend requesting removal directly through your county’s website.
| Date | Buyer | Sale Price | Title Company |
|---|---|---|---|
| Roach Kevin P | $342,500 | -- | |
| Mahoney Francis C | $154,000 | -- | |
| Dauksewich James P | $165,000 | -- |
Source: Public Records
Mortgage History
We collect this data history from publicly available records. To have your information removed, we recommend requesting removal directly through your county’s website.
| Date | Status | Borrower | Loan Amount |
|---|---|---|---|
| Open | Roach Kevin P | $256,875 | |
| Closed | Roach Kevin P | $85,625 | |
| Previous Owner | Dauksewich James P | $139,000 | |
| Previous Owner | Dauksewich James P | $138,600 | |
| Previous Owner | Dauksewich James P | $126,800 |
Source: Public Records
Tax History
| Year | Tax Paid | Tax Assessment Tax Assessment Total Assessment is a certain percentage of the fair market value that is determined by local assessors to be the total taxable value of land and additions on the property. | Land | Improvement |
|---|---|---|---|---|
| 2025 | $5,984 | $516,300 | $240,500 | $275,800 |
| 2024 | $5,831 | $485,900 | $240,500 | $245,400 |
| 2023 | $5,607 | $444,300 | $218,600 | $225,700 |
| 2022 | $5,303 | $387,900 | $196,900 | $191,000 |
| 2021 | $4,951 | $351,900 | $175,800 | $176,100 |
| 2020 | $4,918 | $345,100 | $160,500 | $184,600 |
| 2019 | $4,549 | $322,200 | $145,900 | $176,300 |
| 2018 | $4,597 | $322,800 | $146,100 | $176,700 |
| 2017 | $4,298 | $301,600 | $143,300 | $158,300 |
| 2016 | $4,231 | $296,300 | $139,100 | $157,200 |
| 2015 | $4,075 | $272,000 | $133,800 | $138,200 |
| 2014 | $4,008 | $261,800 | $128,600 | $133,200 |
Source: Public Records
Map
Nearby Homes
Your Personal Tour Guide
Ask me questions while you tour the home.