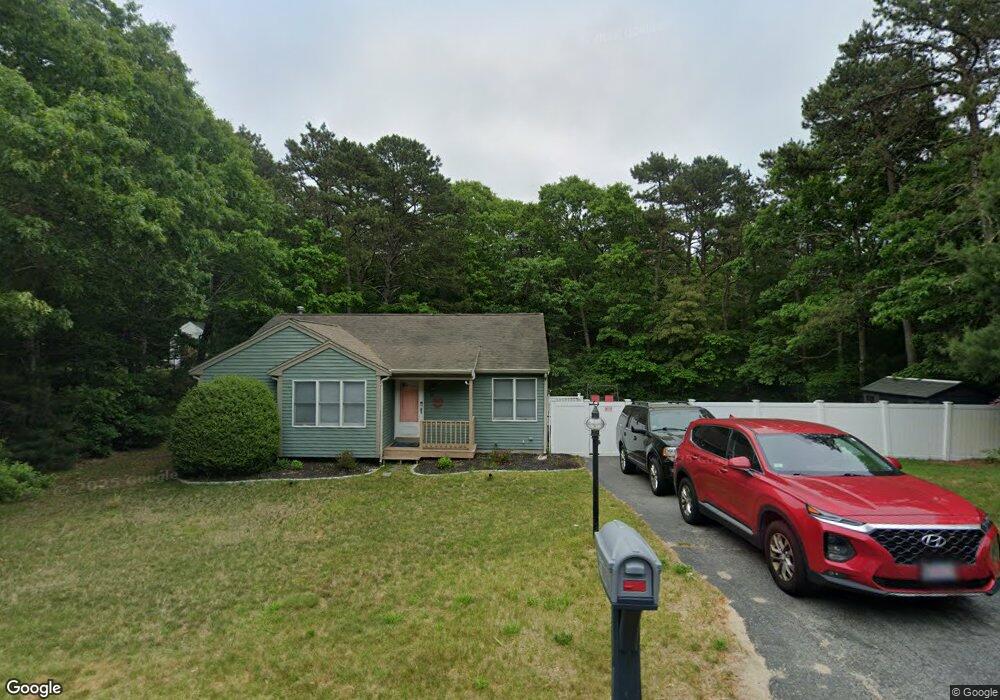
10 High Ridge Dr Bourne, MA 2532
Estimated Value: $569,266 - $649,000
2
Beds
3
Baths
1,142
Sq Ft
$522/Sq Ft
Est. Value
About This Home
This home is located at 10 High Ridge Dr, Bourne, MA 2532 and is currently estimated at $596,067, approximately $521 per square foot. 10 High Ridge Dr is a home located in Barnstable County with nearby schools including Bourne High School and St Margaret Regional School.
Ownership History
Date
Name
Owned For
Owner Type
Purchase Details
Closed on
Feb 19, 2015
Sold by
Onyeokoro Jeffrey
Bought by
Onyeokoro Jeffrey and Pereira Christina E
Current Estimated Value
Purchase Details
Closed on
Jun 16, 2014
Sold by
Carpentino Marian E
Bought by
Onyeokoro Jeffrey
Home Financials for this Owner
Home Financials are based on the most recent Mortgage that was taken out on this home.
Original Mortgage
$241,200
Interest Rate
4.27%
Mortgage Type
New Conventional
Purchase Details
Closed on
May 26, 1999
Sold by
Webber Paul E
Bought by
Carpentino Marian E
Purchase Details
Closed on
Jul 23, 1998
Sold by
Nightingale Ltd Divide
Bought by
Webber Paul E
Create a Home Valuation Report for This Property
The Home Valuation Report is an in-depth analysis detailing your home's value as well as a comparison with similar homes in the area
Purchase History
| Date | Buyer | Sale Price | Title Company |
|---|---|---|---|
| Onyeokoro Jeffrey | -- | -- | |
| Onyeokoro Jeffrey | -- | -- | |
| Onyeokoro Jeffrey | -- | -- | |
| Onyeokoro Jeffrey | -- | -- | |
| Onyeokoro Jeffrey | $268,000 | -- | |
| Onyeokoro Jeffrey | $268,000 | -- | |
| Onyeokoro Jeffrey | $268,000 | -- | |
| Onyeokoro Jeffrey | $268,000 | -- | |
| Carpentino Marian E | $138,375 | -- | |
| Carpentino Marian E | $138,375 | -- | |
| Carpentino Marian E | $138,375 | -- | |
| Carpentino Marian E | $138,375 | -- | |
| Webber Paul E | $131,860 | -- | |
| Nightingale Ltd Divide | $40,000 | -- | |
| Nightingale Ltd Dividn | $40,000 | -- | |
| Webber Paul E | $131,860 | -- | |
| Nightingale Ltd Divide | $40,000 | -- | |
| Nightingale Ltd Dividn | $40,000 | -- |
Source: Public Records
Mortgage History
| Date | Status | Borrower | Loan Amount |
|---|---|---|---|
| Previous Owner | Onyeokoro Jeffrey | $241,200 |
Source: Public Records
Tax History
| Year | Tax Paid | Tax Assessment Tax Assessment Total Assessment is a certain percentage of the fair market value that is determined by local assessors to be the total taxable value of land and additions on the property. | Land | Improvement |
|---|---|---|---|---|
| 2025 | $3,891 | $498,200 | $214,200 | $284,000 |
| 2024 | $3,831 | $477,700 | $204,000 | $273,700 |
| 2023 | $3,869 | $439,200 | $197,000 | $242,200 |
| 2022 | $3,721 | $368,800 | $174,300 | $194,500 |
| 2021 | $3,866 | $337,900 | $158,600 | $179,300 |
| 2020 | $3,542 | $329,800 | $157,100 | $172,700 |
| 2019 | $3,485 | $310,800 | $157,100 | $153,700 |
| 2018 | $3,063 | $290,600 | $149,700 | $140,900 |
| 2017 | $3,275 | $260,400 | $142,100 | $118,300 |
| 2016 | $2,488 | $244,900 | $129,700 | $115,200 |
| 2015 | $2,308 | $229,200 | $123,500 | $105,700 |
Source: Public Records
Map
Nearby Homes
- 304 Main St
- 24 Heather Hill Rd
- 58 Maple St
- 6 Honora Ct
- 48 Maple St
- 3 Honora Ln Unit 3
- 38 Old Bridge Rd
- 29 Weather Deck Rd
- 60 Sandwich Rd
- 23 Alderberry Rd
- 10 Sandy Ln
- 46 Holt Rd Unit B
- 46 Holt Rd
- 44 Cotuit Rd
- 810 Head of The Bay Rd
- 9 Hideaway Rd Unit F
- 40-A Lafayette Ave
- 13 Hideaway Village Unit G
- 5 Zoli Ln
- 4 Van Bummel Rd
- 10 High Ridge Dr
- 10 High Ridge Dr Unit SF
- 1 Whitecliff Rd
- 9 High Ridge Dr
- 12 High Ridge Dr
- 1 White Cliff Rd
- 1 Whitecliff Rd
- 9 High Ridge Dr
- 3 Whitecliff Rd
- 3 Whitecliff Rd
- 14 High Ridge Dr
- 3 White Cliff Rd
- 2 Whitecliff Rd
- 2 White Cliff Rd
- 2 Whitecliff Rd
- 5 Whitecliff Rd
- 5 White Cliff Rd
- 15 High Ridge Dr
- 16 High Ridge Dr
- 18 High Ridge Dr
Your Personal Tour Guide
Ask me questions while you tour the home.