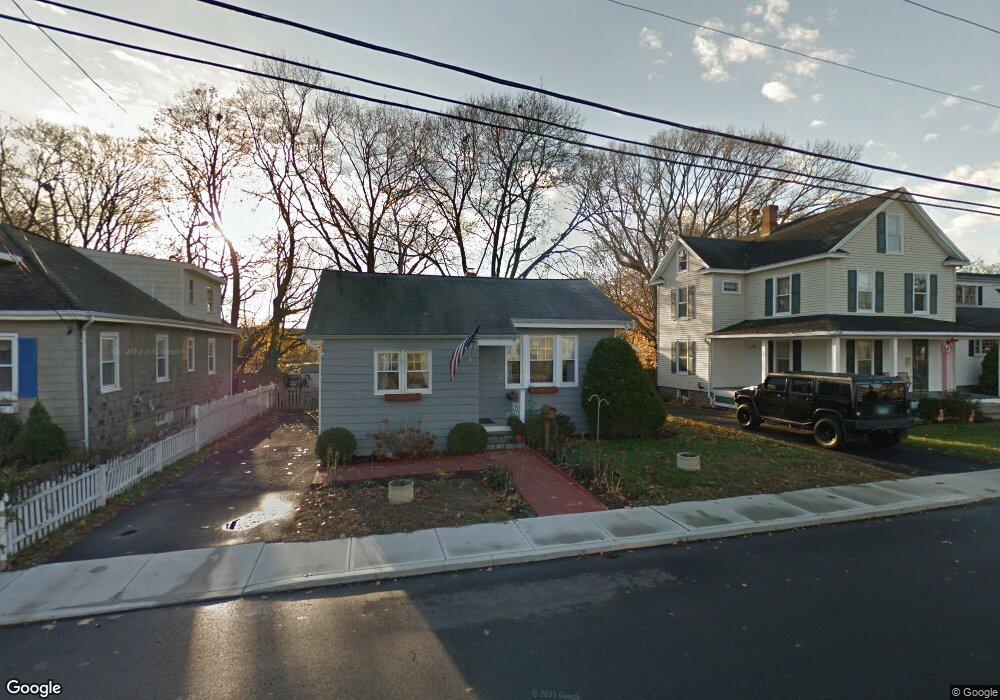
10 Horton St Norwalk, CT 06851
Downtown Norwalk NeighborhoodEstimated Value: $406,000 - $510,250
2
Beds
1
Bath
976
Sq Ft
$478/Sq Ft
Est. Value
About This Home
This home is located at 10 Horton St, Norwalk, CT 06851 and is currently estimated at $466,063, approximately $477 per square foot. 10 Horton St is a home located in Fairfield County with nearby schools including Tracey School, West Rocks Middle School, and Norwalk High School.
Ownership History
Date
Name
Owned For
Owner Type
Purchase Details
Closed on
Dec 2, 2024
Sold by
Guerrero Carlos A
Bought by
Steiert Martha E
Current Estimated Value
Purchase Details
Closed on
Aug 2, 2011
Sold by
Vera Balvino and Vera Maria
Bought by
Guerrero Carlos A and Steiert Martha E
Home Financials for this Owner
Home Financials are based on the most recent Mortgage that was taken out on this home.
Original Mortgage
$233,818
Interest Rate
4.62%
Mortgage Type
FHA
Purchase Details
Closed on
Apr 28, 2006
Sold by
Maisano John
Bought by
Vera Balvino and Vera Maria
Purchase Details
Closed on
Nov 22, 2002
Sold by
Bucnis David V
Bought by
Maisano John
Purchase Details
Closed on
Nov 23, 1999
Sold by
Est Mitchell Pauline and Church Jeanette
Bought by
Bucnis David
Create a Home Valuation Report for This Property
The Home Valuation Report is an in-depth analysis detailing your home's value as well as a comparison with similar homes in the area
Home Values in the Area
Average Home Value in this Area
Purchase History
| Date | Buyer | Sale Price | Title Company |
|---|---|---|---|
| Steiert Martha E | $65,000 | None Available | |
| Steiert Martha E | $65,000 | None Available | |
| Guerrero Carlos A | $239,900 | -- | |
| Guerrero Carlos A | $239,900 | -- | |
| Vera Balvino | $412,000 | -- | |
| Vera Balvino | $412,000 | -- | |
| Maisano John | $240,000 | -- | |
| Maisano John | $240,000 | -- | |
| Bucnis David | $150,000 | -- | |
| Bucnis David | $150,000 | -- |
Source: Public Records
Mortgage History
| Date | Status | Borrower | Loan Amount |
|---|---|---|---|
| Previous Owner | Bucnis David | $269,637 | |
| Previous Owner | Bucnis David | $233,818 |
Source: Public Records
Tax History Compared to Growth
Tax History
| Year | Tax Paid | Tax Assessment Tax Assessment Total Assessment is a certain percentage of the fair market value that is determined by local assessors to be the total taxable value of land and additions on the property. | Land | Improvement |
|---|---|---|---|---|
| 2025 | $6,725 | $281,360 | $133,020 | $148,340 |
| 2024 | $6,625 | $281,360 | $133,020 | $148,340 |
| 2023 | $4,592 | $183,060 | $98,710 | $84,350 |
| 2022 | $4,493 | $183,060 | $98,710 | $84,350 |
| 2021 | $4,388 | $183,060 | $98,710 | $84,350 |
| 2020 | $4,385 | $183,060 | $98,710 | $84,350 |
| 2019 | $4,268 | $183,060 | $98,710 | $84,350 |
| 2018 | $4,737 | $178,060 | $102,340 | $75,720 |
| 2017 | $4,573 | $178,060 | $102,340 | $75,720 |
| 2016 | $4,530 | $178,060 | $102,340 | $75,720 |
| 2015 | $4,517 | $178,060 | $102,340 | $75,720 |
| 2014 | $4,459 | $178,060 | $102,340 | $75,720 |
Source: Public Records
Map
Nearby Homes
- 22 Fair St
- 14 Jefferson St
- 133 Main St Unit 5
- 3 Grandview Ave
- 4 Union Ave Unit 26
- 25 Grand St Unit 204
- 25 Grand St Unit 107
- 25 Grand St Unit 203
- 25 Grand St Unit 245
- 16 Grandview Ave
- 2 Leuvine St Unit 1
- 7 Girard St
- 11 Bedford Ave Unit J2
- 11 Bedford Ave Unit E4
- 31 High St Unit 4-2B
- 31 High St Unit 4-2C
- 18 Prospect Ave Unit C4
- 18 Prospect Ave Unit C15
- 20 Berkeley St
- 14-1/2 Fairview Ave Unit C7
- 8 Horton St
- 12 Horton St
- 6 Horton St
- 14 Horton St
- 1 Loundsbury Ave
- 4 Horton St
- 3 Loundsbury Ave
- 16 Horton St
- 5 Loundsbury Ave
- 2 Loundsbury Ave
- 12 Fair St
- 4 Loundsbury Ave
- 6 Loundsbury Ave
- 9 Loundsbury Ave
- 14 Fair St
- 11 Loundsbury Ave
- 10 Loundsbury Ave
- 33 Wilton Ave
- 33 Wilton Ave Unit 3
- 31 Wilton Ave