Estimated Value: $565,973 - $807,000
--
Bed
--
Bath
3,605
Sq Ft
$185/Sq Ft
Est. Value
About This Home
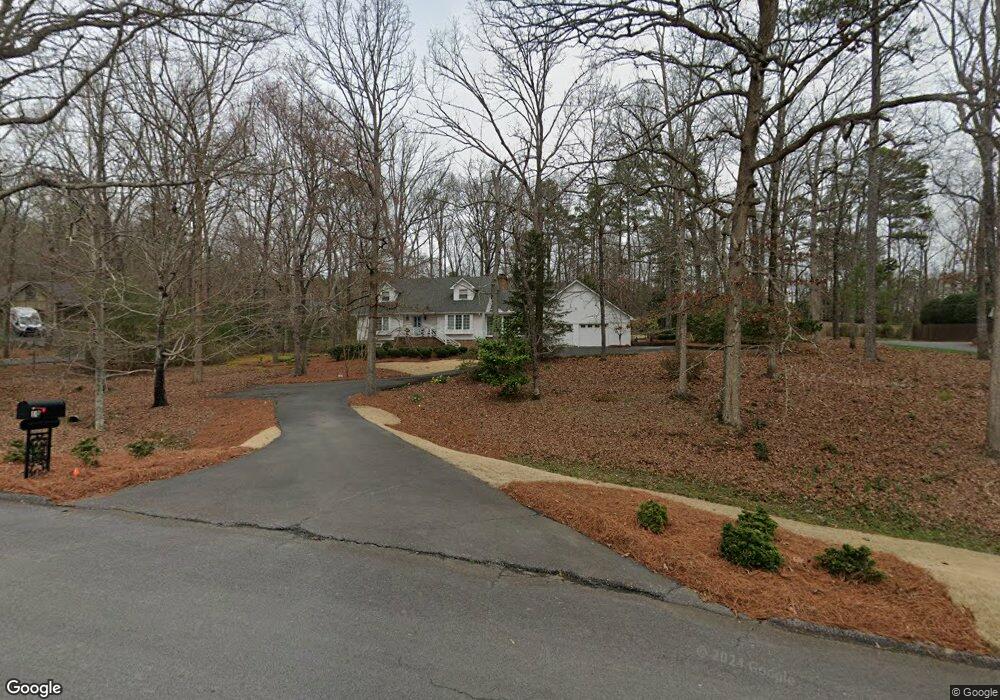
This home is located at 10 Huntington Rd SW, Rome, GA 30165 and is currently estimated at $667,243, approximately $185 per square foot. 10 Huntington Rd SW is a home located in Floyd County with nearby schools including Coosa Middle School and Coosa High School.
Ownership History
Date
Name
Owned For
Owner Type
Purchase Details
Closed on
Jul 25, 2007
Sold by
Not Provided
Bought by
Mccollum Gregory W and Mccollum Barbara P
Current Estimated Value
Purchase Details
Closed on
Jun 15, 1990
Sold by
Meadows Douglas H
Bought by
Jarrell Richard C and Jarrell Marie D
Purchase Details
Closed on
Mar 3, 1986
Sold by
Morgan & Hunt Oil Co
Bought by
Meadows Douglas H
Purchase Details
Closed on
Dec 10, 1985
Sold by
P\R Hunt J Louise S
Bought by
Hunt T Elwood & Morgan & Hunt Oil Co
Purchase Details
Closed on
Jun 20, 1979
Sold by
Hunt Hunt T and Hunt Louise S
Bought by
P\R Hunt J Louise S
Purchase Details
Closed on
Jan 15, 1973
Sold by
Sheron-Toles Inc
Bought by
Hunt Hunt T and Hunt Louise S
Purchase Details
Closed on
May 19, 1972
Bought by
Sheron-Toles Inc
Create a Home Valuation Report for This Property
The Home Valuation Report is an in-depth analysis detailing your home's value as well as a comparison with similar homes in the area
Home Values in the Area
Average Home Value in this Area
Purchase History
| Date | Buyer | Sale Price | Title Company |
|---|---|---|---|
| Mccollum Gregory W | $375,000 | -- | |
| Jarrell Richard C | $220,000 | -- | |
| Meadows Douglas H | $159,000 | -- | |
| Hunt T Elwood & Morgan & Hunt Oil Co | -- | -- | |
| Morgan & Hunt Oil Co | $155,000 | -- | |
| P\R Hunt J Louise S | -- | -- | |
| Hunt Hunt T | $7,000 | -- | |
| Sheron-Toles Inc | -- | -- |
Source: Public Records
Tax History Compared to Growth
Tax History
| Year | Tax Paid | Tax Assessment Tax Assessment Total Assessment is a certain percentage of the fair market value that is determined by local assessors to be the total taxable value of land and additions on the property. | Land | Improvement |
|---|---|---|---|---|
| 2024 | $5,645 | $236,098 | $46,957 | $189,141 |
| 2023 | $5,670 | $226,640 | $42,688 | $183,952 |
| 2022 | $5,041 | $188,528 | $35,402 | $153,126 |
| 2021 | $4,790 | $170,299 | $32,259 | $138,040 |
| 2020 | $4,809 | $169,579 | $28,051 | $141,528 |
| 2019 | $4,623 | $162,686 | $28,051 | $134,635 |
| 2018 | $4,475 | $154,340 | $26,716 | $127,624 |
| 2017 | $4,341 | $146,535 | $24,737 | $121,798 |
| 2016 | $4,158 | $137,080 | $24,720 | $112,360 |
| 2015 | $4,017 | $135,258 | $24,720 | $110,538 |
| 2014 | $4,017 | $135,258 | $24,720 | $110,538 |
Source: Public Records
Map
Nearby Homes
- 1 Huntington Rd SW
- 2 Kensington Rd SW
- 1 Windsor Rd SW
- 5 Saint Andrews Way SW
- 0 Belle Meade Dr SW Unit 10504645
- 5 Andrea Ct SW
- 11 Brow Rd SW
- 0 Hidden Ridge Dr Unit 10556470
- 0 Hidden Ridge Dr Unit 10343706
- 0 Hidden Ridge Dr Unit 10343701
- 0 Hidden Ridge Dr Unit 10343700
- 0 Hidden Ridge Dr Unit 10343696
- 0 Hidden Ridge Dr Unit 10343694
- 0 Hidden Ridge Dr Unit 10343693
- 0 Hidden Ridge Dr Unit 10343689
- 0 Hidden Ridge Dr Unit 10343688
- 0 Hidden Ridge Dr Unit 10343685
- 0 Hidden Ridge Dr Unit 10343680
- 0 Hidden Ridge Dr Unit 10343676
- 0 Featherston Rd SW Unit 10512723
- 8 Huntington Rd SW
- 12 Huntington Rd SW
- 153 Whippoorwill Ln SW
- 171 Whippoorwill Ln SW
- 7 Huntington Rd SW
- 6 Huntington Rd SW
- 1414 Horseleg Creek Rd SW
- 14 Huntington Rd SW
- 129 Whippoorwill Ln SW
- 9 Huntington Rd SW
- 221 Whippoorwill Ln SW
- 4 Huntington Rd SW
- 184 Whippoorwill Ln SW
- 184 Whippoorwill Ln SW
- 16 Huntington Rd SW
- 109 Whippoorwill Ln SW
- 109 Whippoorwill Ln SW
- 1392 Horseleg Creek Rd SW
- 11 Huntington Rd SW
- 5 Huntington Rd SW