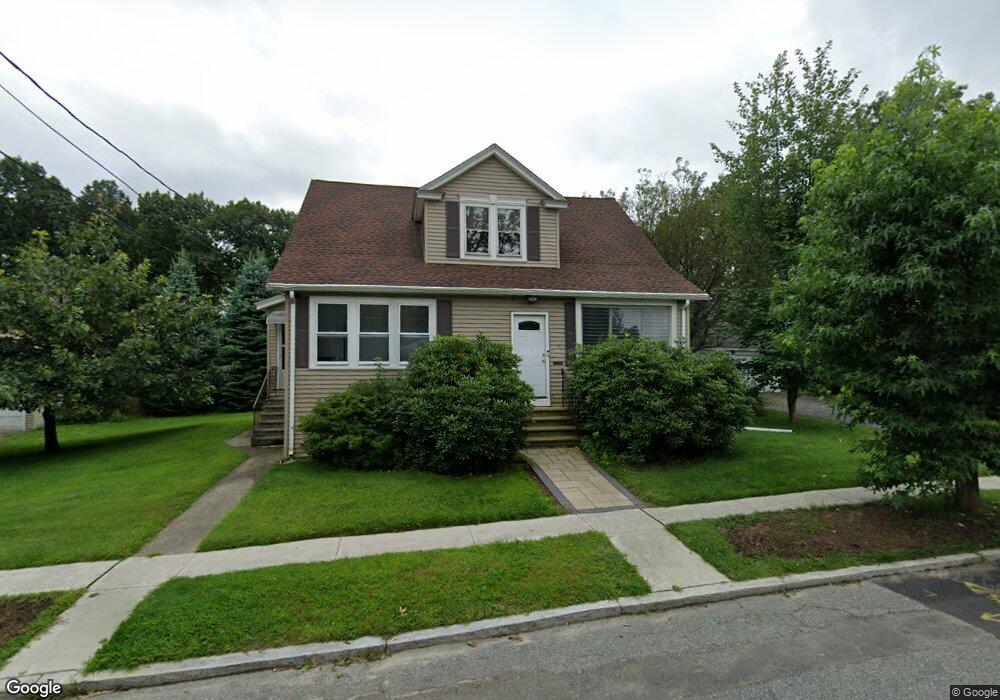
10 Ivernia Rd Worcester, MA 01606
Burncoat NeighborhoodEstimated Value: $439,012 - $463,000
2
Beds
2
Baths
1,440
Sq Ft
$315/Sq Ft
Est. Value
About This Home
This home is located at 10 Ivernia Rd, Worcester, MA 01606 and is currently estimated at $453,003, approximately $314 per square foot. 10 Ivernia Rd is a home located in Worcester County with nearby schools including Belmont Street Community School, Jacob Hiatt Magnet School, and Chandler Magnet.
Ownership History
Date
Name
Owned For
Owner Type
Purchase Details
Closed on
Sep 16, 2009
Sold by
Hom Janice M Ciccolini and Herrmann Doris J
Bought by
Sullivan Greg P
Current Estimated Value
Home Financials for this Owner
Home Financials are based on the most recent Mortgage that was taken out on this home.
Original Mortgage
$145,000
Outstanding Balance
$95,262
Interest Rate
5.28%
Mortgage Type
Purchase Money Mortgage
Estimated Equity
$357,741
Purchase Details
Closed on
May 29, 2008
Sold by
Jal Ret and Hermann Doris J
Bought by
Herrman Tr Doris J and Janice M Ciccolini
Purchase Details
Closed on
Feb 19, 2008
Sold by
Herrmann Doris J and Lindsay Jeannette A
Bought by
Jal Ret and Herrmann Doris J
Create a Home Valuation Report for This Property
The Home Valuation Report is an in-depth analysis detailing your home's value as well as a comparison with similar homes in the area
Home Values in the Area
Average Home Value in this Area
Purchase History
| Date | Buyer | Sale Price | Title Company |
|---|---|---|---|
| Sullivan Greg P | $195,000 | -- | |
| Herrman Tr Doris J | -- | -- | |
| Jal Ret | -- | -- |
Source: Public Records
Mortgage History
| Date | Status | Borrower | Loan Amount |
|---|---|---|---|
| Open | Sullivan Greg P | $145,000 |
Source: Public Records
Tax History Compared to Growth
Tax History
| Year | Tax Paid | Tax Assessment Tax Assessment Total Assessment is a certain percentage of the fair market value that is determined by local assessors to be the total taxable value of land and additions on the property. | Land | Improvement |
|---|---|---|---|---|
| 2025 | $4,770 | $361,600 | $119,300 | $242,300 |
| 2024 | $4,676 | $340,100 | $119,300 | $220,800 |
| 2023 | $4,491 | $313,200 | $103,700 | $209,500 |
| 2022 | $4,102 | $269,700 | $83,000 | $186,700 |
| 2021 | $3,883 | $238,500 | $66,400 | $172,100 |
| 2020 | $3,806 | $223,900 | $66,300 | $157,600 |
| 2019 | $3,605 | $200,300 | $60,000 | $140,300 |
| 2018 | $3,595 | $190,100 | $60,000 | $130,100 |
| 2017 | $3,483 | $181,200 | $60,000 | $121,200 |
| 2016 | $3,467 | $168,200 | $45,400 | $122,800 |
| 2015 | $3,376 | $168,200 | $45,400 | $122,800 |
| 2014 | $3,287 | $168,200 | $45,400 | $122,800 |
Source: Public Records
Map
Nearby Homes
- 49 E Mountain St
- 15 Inwood Rd
- 29 E Mountain
- 12 Dixfield Rd
- 87 Malden St
- 95 Saint Nicholas Ave
- 2 Maria Ln Unit 2
- 10 Beale St
- 9 Idalla Ave
- 40 Francis St
- 31 Enaya Cir Unit 31
- 13 Fatima Ln
- 15 Cumberland St
- 31 Danielles Way
- 22 Danielles Way
- 26 Danielles Way
- 28 Brooks St
- 1110 W Boylston St Unit A
- 23 Orono St
- 71 Hillside Village Dr