Estimated Value: $415,603 - $633,000
3
Beds
2
Baths
1,214
Sq Ft
$445/Sq Ft
Est. Value
About This Home
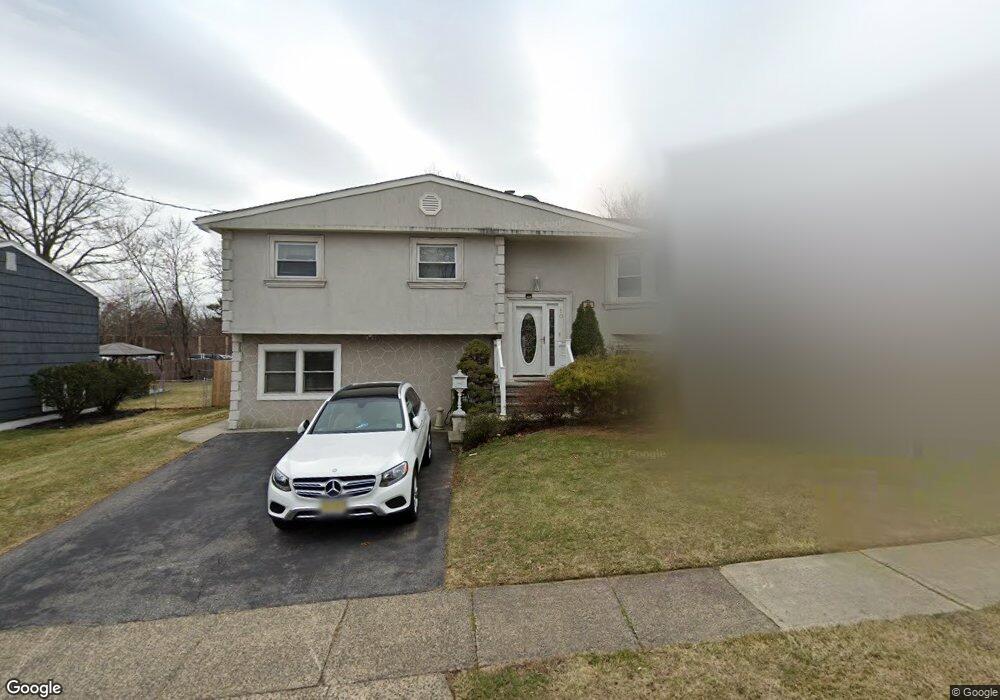
This home is located at 10 Jackson Ct, Fords, NJ 08863 and is currently estimated at $539,901, approximately $444 per square foot. 10 Jackson Ct is a home located in Middlesex County with nearby schools including Ford Avenue Elementary School, Fords Middle School, and Woodbridge High School.
Ownership History
Date
Name
Owned For
Owner Type
Purchase Details
Closed on
Nov 16, 2015
Sold by
Zhu Feng and Zhu Jian Hui
Bought by
Zhu Feng
Current Estimated Value
Purchase Details
Closed on
Dec 1, 2014
Sold by
Mendez Donnald
Bought by
Zhu Feng and Zhu Jian Hui
Purchase Details
Closed on
Apr 15, 2005
Sold by
Montero Aida
Bought by
Mendez Donnald
Home Financials for this Owner
Home Financials are based on the most recent Mortgage that was taken out on this home.
Original Mortgage
$304,000
Interest Rate
5.87%
Mortgage Type
New Conventional
Purchase Details
Closed on
Dec 3, 2003
Sold by
Montero Aida M
Bought by
Montero Aida M
Create a Home Valuation Report for This Property
The Home Valuation Report is an in-depth analysis detailing your home's value as well as a comparison with similar homes in the area
Home Values in the Area
Average Home Value in this Area
Purchase History
| Date | Buyer | Sale Price | Title Company |
|---|---|---|---|
| Zhu Feng | -- | None Available | |
| Zhu Feng | $335,000 | None Available | |
| Mendez Donnald | $380,000 | -- | |
| Montero Aida M | -- | -- |
Source: Public Records
Mortgage History
| Date | Status | Borrower | Loan Amount |
|---|---|---|---|
| Previous Owner | Mendez Donnald | $304,000 |
Source: Public Records
Tax History Compared to Growth
Tax History
| Year | Tax Paid | Tax Assessment Tax Assessment Total Assessment is a certain percentage of the fair market value that is determined by local assessors to be the total taxable value of land and additions on the property. | Land | Improvement |
|---|---|---|---|---|
| 2025 | $10,897 | $86,300 | $23,000 | $63,300 |
| 2024 | $10,580 | $86,300 | $23,000 | $63,300 |
| 2023 | $10,580 | $86,300 | $23,000 | $63,300 |
| 2022 | $10,295 | $86,300 | $23,000 | $63,300 |
| 2021 | $10,189 | $86,300 | $23,000 | $63,300 |
| 2020 | $9,857 | $86,300 | $23,000 | $63,300 |
| 2019 | $9,603 | $86,300 | $23,000 | $63,300 |
| 2018 | $9,414 | $86,300 | $23,000 | $63,300 |
| 2017 | $9,248 | $86,300 | $23,000 | $63,300 |
| 2016 | $9,172 | $86,300 | $23,000 | $63,300 |
| 2015 | $8,993 | $86,300 | $23,000 | $63,300 |
| 2014 | $8,797 | $86,300 | $23,000 | $63,300 |
Source: Public Records
Map
Nearby Homes
- 204 Marlin Dr
- 250 Ford Ave
- 55 Murdock St
- 29 Highland Terrace
- 110 Sheppard Place
- 891 Main St
- 30 Overlook Terrace
- 59 Hearthstone Ave
- 206 Arlington Dr
- 1008 Main St
- 37 Summit Ave
- 33 Larchmont Rd
- 38 Evergreen Ave
- 134 Beech St
- 141 Dunbar Ave
- 26 Wildwood Ave
- 25 Wildwood Ave
- 93 Remmey St
- 537 Ford Ave
- 128 Burnham Dr