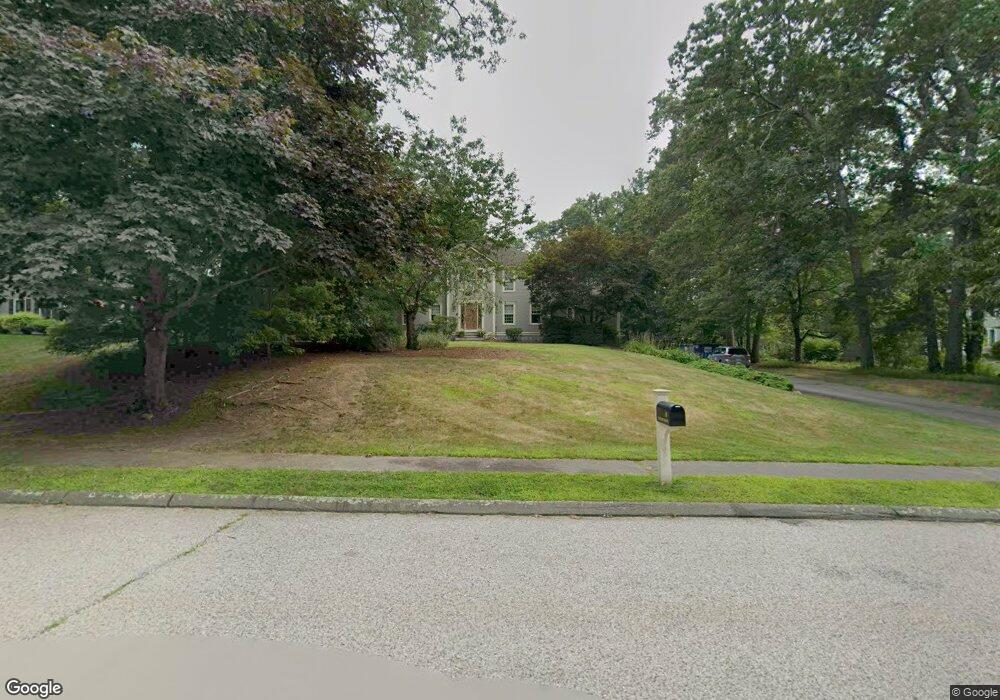
10 Jacob Dr Mansfield, MA 02048
Estimated Value: $945,336 - $1,066,000
3
Beds
3
Baths
2,850
Sq Ft
$349/Sq Ft
Est. Value
About This Home
This home is located at 10 Jacob Dr, Mansfield, MA 02048 and is currently estimated at $995,834, approximately $349 per square foot. 10 Jacob Dr is a home located in Bristol County with nearby schools including Everett W. Robinson Elementary School, Jordan/Jackson Elementary School, and Harold L. Qualters Middle School.
Ownership History
Date
Name
Owned For
Owner Type
Purchase Details
Closed on
Aug 11, 2003
Sold by
Baker Deborah L and Baker Francis A
Bought by
Guadagnoli Eileen T
Current Estimated Value
Home Financials for this Owner
Home Financials are based on the most recent Mortgage that was taken out on this home.
Original Mortgage
$435,000
Outstanding Balance
$180,412
Interest Rate
5.28%
Mortgage Type
Purchase Money Mortgage
Estimated Equity
$815,422
Create a Home Valuation Report for This Property
The Home Valuation Report is an in-depth analysis detailing your home's value as well as a comparison with similar homes in the area
Home Values in the Area
Average Home Value in this Area
Purchase History
| Date | Buyer | Sale Price | Title Company |
|---|---|---|---|
| Guadagnoli Eileen T | $670,000 | -- |
Source: Public Records
Mortgage History
| Date | Status | Borrower | Loan Amount |
|---|---|---|---|
| Open | Guadagnoli Eileen T | $435,000 |
Source: Public Records
Tax History
| Year | Tax Paid | Tax Assessment Tax Assessment Total Assessment is a certain percentage of the fair market value that is determined by local assessors to be the total taxable value of land and additions on the property. | Land | Improvement |
|---|---|---|---|---|
| 2025 | $11,425 | $867,500 | $266,000 | $601,500 |
| 2024 | $11,165 | $827,000 | $278,100 | $548,900 |
| 2023 | $10,722 | $761,000 | $278,100 | $482,900 |
| 2022 | $10,269 | $676,900 | $257,400 | $419,500 |
| 2021 | $5,630 | $672,900 | $242,600 | $430,300 |
| 2020 | $10,164 | $661,700 | $242,600 | $419,100 |
| 2019 | $3,561 | $648,200 | $225,400 | $422,800 |
| 2018 | $5,009 | $630,300 | $214,900 | $415,400 |
| 2017 | $4,728 | $613,000 | $208,800 | $404,200 |
| 2016 | $9,300 | $603,500 | $229,000 | $374,500 |
| 2015 | $9,066 | $584,900 | $229,000 | $355,900 |
Source: Public Records
Map
Nearby Homes
- 128 Tremont St
- 17 Childs Ln
- 24 Maverick Dr
- 1769 West St
- 25 Shepherd St
- 401 South St
- 150 Gilbert St
- 14 Claire Ave
- 346 South St
- 40 Treasure Island Rd
- 16 Treasure Island Rd
- 9 Coach Rd
- 84 Messenger St
- 33 Colonial Way
- 25 Munroe Dr
- 166 Chauncy St
- 46 Mirimichi St
- 38 Mirimichi St
- 356 Central St
- 2 Oak St Unit 2B
Your Personal Tour Guide
Ask me questions while you tour the home.