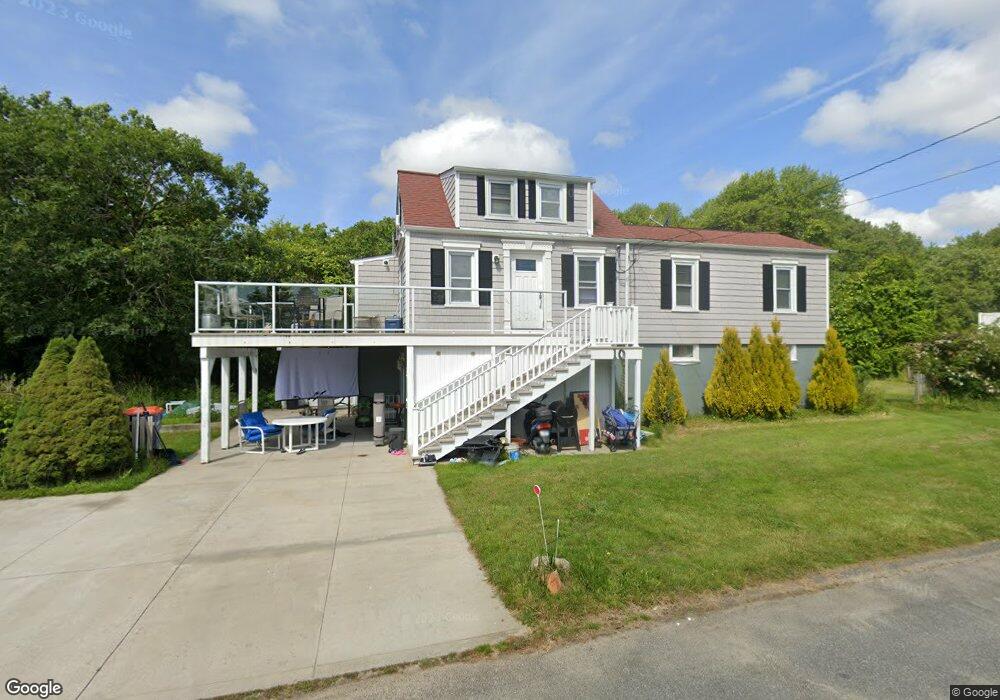
10 James St Fairhaven, MA 02719
Estimated Value: $426,595 - $729,000
3
Beds
2
Baths
750
Sq Ft
$789/Sq Ft
Est. Value
About This Home
This home is located at 10 James St, Fairhaven, MA 02719 and is currently estimated at $591,649, approximately $788 per square foot. 10 James St is a home located in Bristol County with nearby schools including Fairhaven High School, City On A Hill Charter Public School New Bedford, and St. Joseph School.
Ownership History
Date
Name
Owned For
Owner Type
Purchase Details
Closed on
Mar 17, 2008
Sold by
Leon Mary L Est
Bought by
Robitaille Nawal G and Robitaille Raymond O
Current Estimated Value
Home Financials for this Owner
Home Financials are based on the most recent Mortgage that was taken out on this home.
Original Mortgage
$240,000
Outstanding Balance
$149,356
Interest Rate
5.72%
Mortgage Type
Purchase Money Mortgage
Estimated Equity
$442,293
Purchase Details
Closed on
Oct 6, 2004
Sold by
Leoutsakos Christina D and Valliere Stephanie Tl
Bought by
Leon Mary L
Create a Home Valuation Report for This Property
The Home Valuation Report is an in-depth analysis detailing your home's value as well as a comparison with similar homes in the area
Home Values in the Area
Average Home Value in this Area
Purchase History
| Date | Buyer | Sale Price | Title Company |
|---|---|---|---|
| Robitaille Nawal G | $375,000 | -- | |
| Leon Mary L | -- | -- |
Source: Public Records
Mortgage History
| Date | Status | Borrower | Loan Amount |
|---|---|---|---|
| Open | Leon Mary L | $240,000 |
Source: Public Records
Tax History Compared to Growth
Tax History
| Year | Tax Paid | Tax Assessment Tax Assessment Total Assessment is a certain percentage of the fair market value that is determined by local assessors to be the total taxable value of land and additions on the property. | Land | Improvement |
|---|---|---|---|---|
| 2025 | $33 | $356,800 | $190,400 | $166,400 |
| 2024 | $3,224 | $349,300 | $190,400 | $158,900 |
| 2023 | $3,218 | $323,400 | $176,500 | $146,900 |
| 2022 | $3,165 | $309,700 | $168,200 | $141,500 |
| 2021 | $3,032 | $268,600 | $152,900 | $115,700 |
| 2020 | $2,894 | $261,700 | $146,000 | $115,700 |
| 2019 | $2,805 | $240,400 | $132,900 | $107,500 |
| 2018 | $2,704 | $226,600 | $126,600 | $100,000 |
| 2017 | $2,633 | $218,700 | $126,600 | $92,100 |
| 2016 | $2,469 | $202,700 | $126,600 | $76,100 |
| 2015 | $2,437 | $200,600 | $126,600 | $74,000 |
Source: Public Records
Map
Nearby Homes