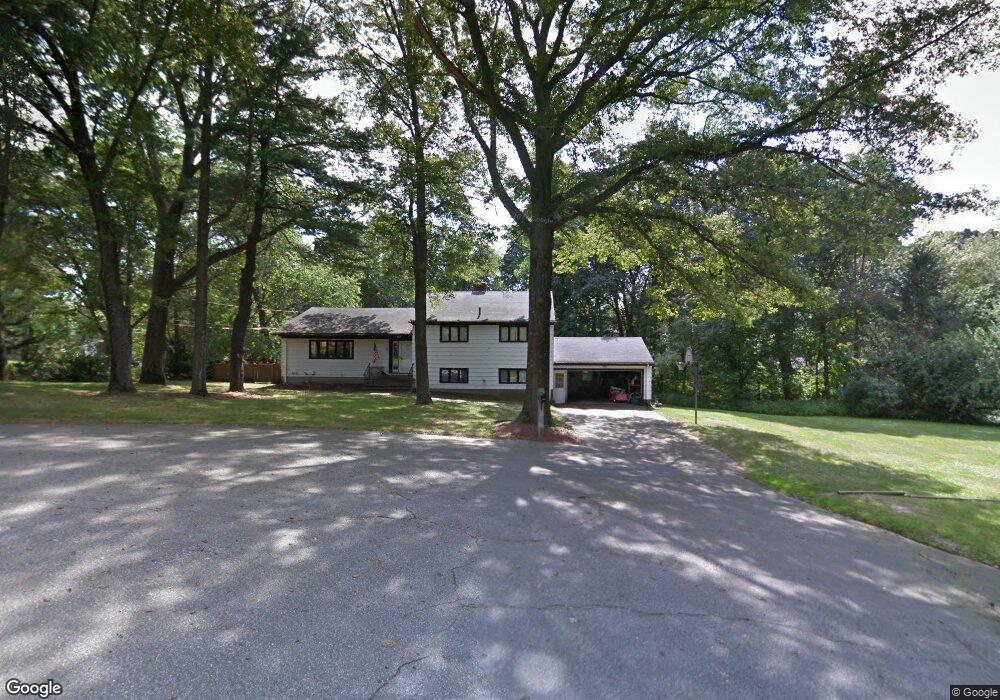
10 Jensen St Lynnfield, MA 01940
Estimated Value: $845,000 - $1,038,664
4
Beds
3
Baths
2,660
Sq Ft
$356/Sq Ft
Est. Value
About This Home
This home is located at 10 Jensen St, Lynnfield, MA 01940 and is currently estimated at $946,916, approximately $355 per square foot. 10 Jensen St is a home located in Essex County with nearby schools including Lynnfield Middle School, Lynnfield High School, and Our Lady Of Assumption School.
Ownership History
Date
Name
Owned For
Owner Type
Purchase Details
Closed on
Oct 20, 2014
Sold by
Collins Steven F
Bought by
Collins Shannon M
Current Estimated Value
Home Financials for this Owner
Home Financials are based on the most recent Mortgage that was taken out on this home.
Original Mortgage
$171,500
Outstanding Balance
$131,431
Interest Rate
4.09%
Mortgage Type
New Conventional
Estimated Equity
$815,485
Purchase Details
Closed on
Nov 1, 1995
Sold by
Rhudick Paul J
Bought by
Collins Steven F and Collins Shannon M
Create a Home Valuation Report for This Property
The Home Valuation Report is an in-depth analysis detailing your home's value as well as a comparison with similar homes in the area
Home Values in the Area
Average Home Value in this Area
Purchase History
| Date | Buyer | Sale Price | Title Company |
|---|---|---|---|
| Collins Shannon M | -- | -- | |
| Collins Steven F | $207,500 | -- |
Source: Public Records
Mortgage History
| Date | Status | Borrower | Loan Amount |
|---|---|---|---|
| Open | Collins Shannon M | $171,500 | |
| Previous Owner | Collins Steven F | $200,000 | |
| Previous Owner | Collins Steven F | $50,000 |
Source: Public Records
Tax History
| Year | Tax Paid | Tax Assessment Tax Assessment Total Assessment is a certain percentage of the fair market value that is determined by local assessors to be the total taxable value of land and additions on the property. | Land | Improvement |
|---|---|---|---|---|
| 2025 | $9,700 | $918,600 | $573,000 | $345,600 |
| 2024 | $9,282 | $883,200 | $550,900 | $332,300 |
| 2023 | $9,307 | $823,600 | $522,500 | $301,100 |
| 2022 | $9,004 | $751,000 | $479,800 | $271,200 |
| 2021 | $8,533 | $643,000 | $391,000 | $252,000 |
| 2020 | $8,383 | $602,200 | $350,100 | $252,100 |
| 2019 | $8,377 | $602,200 | $350,100 | $252,100 |
| 2018 | $8,286 | $602,200 | $350,100 | $252,100 |
| 2017 | $8,127 | $589,800 | $337,700 | $252,100 |
| 2016 | $7,437 | $512,900 | $289,700 | $223,200 |
| 2015 | $7,416 | $511,800 | $288,600 | $223,200 |
Source: Public Records
Map
Nearby Homes
Your Personal Tour Guide
Ask me questions while you tour the home.