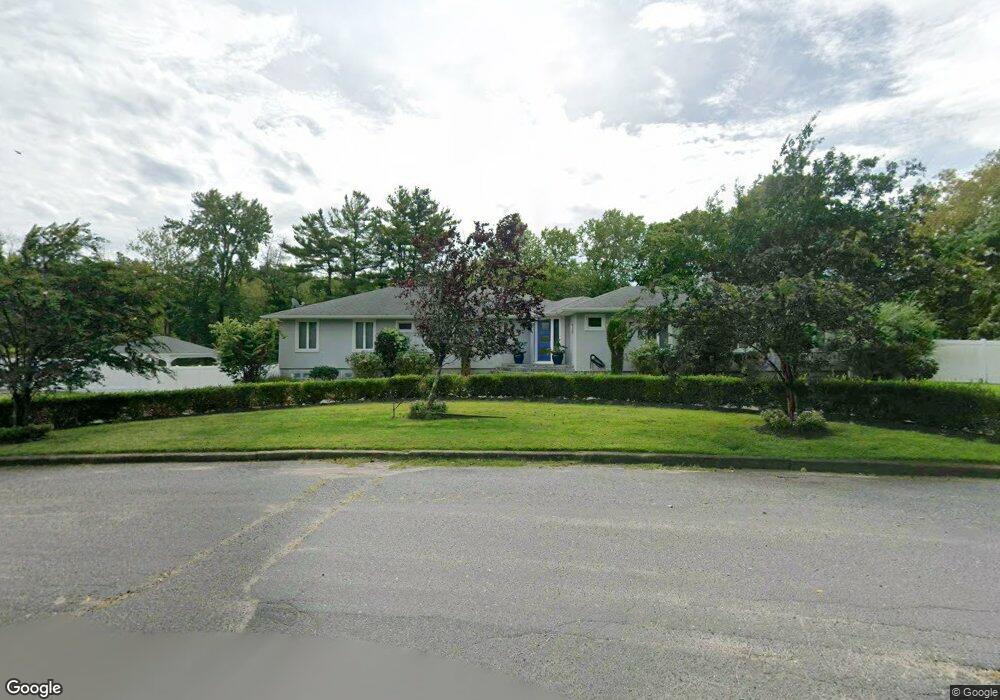
10 Jonathon Ct West Long Branch, NJ 07764
Estimated Value: $1,644,000 - $2,037,000
4
Beds
3
Baths
2,280
Sq Ft
$829/Sq Ft
Est. Value
About This Home
This home is located at 10 Jonathon Ct, West Long Branch, NJ 07764 and is currently estimated at $1,889,808, approximately $828 per square foot. 10 Jonathon Ct is a home located in Monmouth County with nearby schools including Betty McElmon Elementary School, Frank Antonides School, and Shore Regional High School.
Ownership History
Date
Name
Owned For
Owner Type
Purchase Details
Closed on
Nov 2, 2012
Sold by
Moule Partners Llc
Bought by
Abed Joseph and Abed Pauline
Current Estimated Value
Purchase Details
Closed on
Sep 2, 2011
Sold by
Franco Samuel S and Franco Susan
Bought by
Moule Partners Llc
Purchase Details
Closed on
Aug 14, 2007
Sold by
Franco Isaac S
Bought by
Franco Samuel S and Franco Susan
Purchase Details
Closed on
Nov 17, 2005
Sold by
Aboud Rachamim
Bought by
Franco Isaac S
Purchase Details
Closed on
May 18, 2005
Sold by
Congregation Bnei Yeshiva
Bought by
Franco Samuel S
Create a Home Valuation Report for This Property
The Home Valuation Report is an in-depth analysis detailing your home's value as well as a comparison with similar homes in the area
Home Values in the Area
Average Home Value in this Area
Purchase History
| Date | Buyer | Sale Price | Title Company |
|---|---|---|---|
| Abed Joseph | $375,000 | Chicago Title Ins Co | |
| Moule Partners Llc | $392,000 | First American Title | |
| Franco Samuel S | -- | None Available | |
| Franco Isaac S | -- | -- | |
| Franco Samuel S | -- | -- | |
| Aboud Rachamim | -- | -- |
Source: Public Records
Tax History Compared to Growth
Tax History
| Year | Tax Paid | Tax Assessment Tax Assessment Total Assessment is a certain percentage of the fair market value that is determined by local assessors to be the total taxable value of land and additions on the property. | Land | Improvement |
|---|---|---|---|---|
| 2025 | $23,791 | $2,032,900 | $1,272,800 | $760,100 |
| 2024 | $20,768 | $1,825,900 | $1,079,800 | $746,100 |
| 2023 | $20,768 | $1,486,600 | $824,400 | $662,200 |
| 2022 | $17,948 | $1,227,800 | $687,200 | $540,600 |
| 2021 | $17,948 | $928,500 | $534,000 | $394,500 |
| 2020 | $16,241 | $790,300 | $404,700 | $385,600 |
| 2019 | $15,906 | $778,200 | $394,800 | $383,400 |
| 2018 | $15,902 | $751,500 | $386,000 | $365,500 |
| 2017 | $16,048 | $724,200 | $369,800 | $354,400 |
| 2016 | $10,651 | $490,400 | $287,200 | $203,200 |
| 2015 | $10,553 | $485,200 | $287,200 | $198,000 |
| 2014 | $10,513 | $451,000 | $262,200 | $188,800 |
Source: Public Records
Map
Nearby Homes
- 10 Jonathon Ct Unit WINTER
- 149 Larchwood Ave
- 9 Jonathon Ct
- 141 Larchwood Ave
- 7 Jonathon Ct
- 133 Larchwood Ave
- 15 Pleasant Dr
- 13 Pleasant Dr
- 17 Pleasant Dr
- 1 Old Farm Rd
- 11 Pleasant Dr
- 5 Jonathon Ct
- 33 Larchwood Ave
- 125 Larchwood Ave
- 3 Old Farm Rd
- 261 Howard Ave
- 5 Old Farm Rd
- 16 Bridle Dr
- 22 Palmer Ave
- 21 Bridle Dr