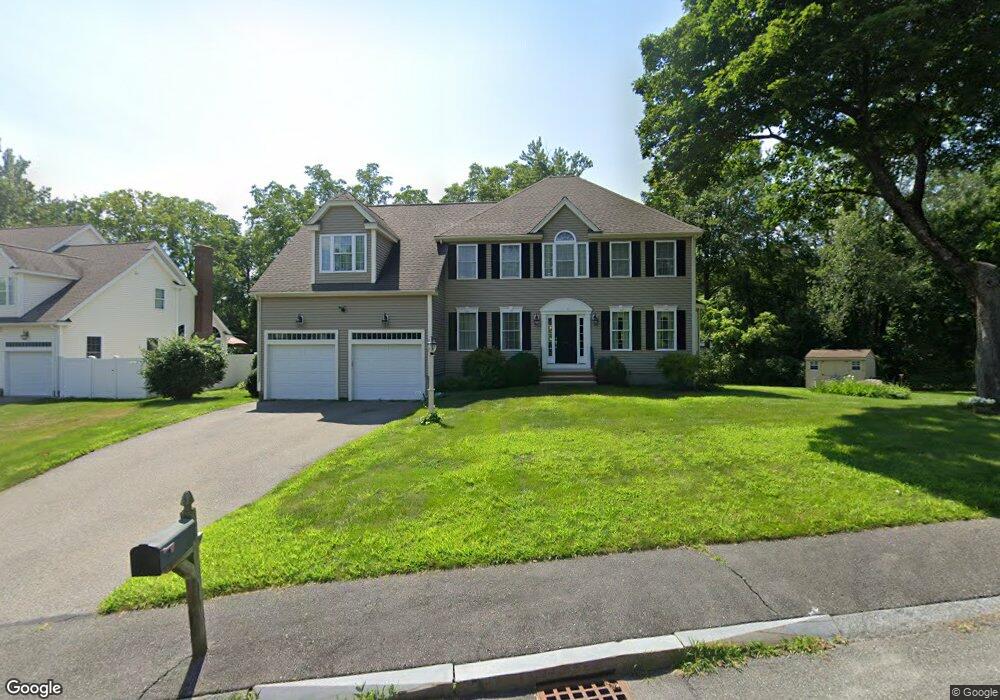
10 Joseph North Rd Marlborough, MA 01752
French Hill NeighborhoodEstimated Value: $787,000 - $927,000
4
Beds
3
Baths
2,768
Sq Ft
$310/Sq Ft
Est. Value
About This Home
This home is located at 10 Joseph North Rd, Marlborough, MA 01752 and is currently estimated at $857,889, approximately $309 per square foot. 10 Joseph North Rd is a home located in Middlesex County with nearby schools including Marlborough High School, New Covenant Christian School, and Hillside School.
Ownership History
Date
Name
Owned For
Owner Type
Purchase Details
Closed on
Feb 13, 2019
Sold by
Schandelmayer Barbara A
Bought by
Schandelmayer Leeann M
Current Estimated Value
Purchase Details
Closed on
Jul 3, 2012
Sold by
Schandelmayer Barbara A and Schandelmayer Leeann M
Bought by
Schandelmayer Leeann M
Purchase Details
Closed on
Oct 19, 2005
Sold by
Nobel Constr Co Inc
Bought by
Schandelmayer Barbara A and Schandelmayer Leeann M
Home Financials for this Owner
Home Financials are based on the most recent Mortgage that was taken out on this home.
Original Mortgage
$380,000
Interest Rate
5.72%
Mortgage Type
Purchase Money Mortgage
Create a Home Valuation Report for This Property
The Home Valuation Report is an in-depth analysis detailing your home's value as well as a comparison with similar homes in the area
Home Values in the Area
Average Home Value in this Area
Purchase History
| Date | Buyer | Sale Price | Title Company |
|---|---|---|---|
| Schandelmayer Leeann M | -- | -- | |
| Schandelmayer Leeann M | -- | -- | |
| Schandelmayer Barbara A | $574,800 | -- |
Source: Public Records
Mortgage History
| Date | Status | Borrower | Loan Amount |
|---|---|---|---|
| Previous Owner | Schandelmayer Barbara A | $380,000 |
Source: Public Records
Tax History
| Year | Tax Paid | Tax Assessment Tax Assessment Total Assessment is a certain percentage of the fair market value that is determined by local assessors to be the total taxable value of land and additions on the property. | Land | Improvement |
|---|---|---|---|---|
| 2025 | $7,875 | $798,700 | $227,400 | $571,300 |
| 2024 | $7,553 | $737,600 | $206,700 | $530,900 |
| 2023 | $7,946 | $688,600 | $176,800 | $511,800 |
| 2022 | $7,640 | $582,300 | $168,300 | $414,000 |
| 2021 | $7,560 | $547,200 | $140,300 | $406,900 |
| 2020 | $7,418 | $523,100 | $133,600 | $389,500 |
| 2019 | $7,159 | $508,800 | $130,900 | $377,900 |
| 2018 | $7,077 | $483,700 | $111,500 | $372,200 |
| 2017 | $7,017 | $458,000 | $109,000 | $349,000 |
| 2016 | $6,851 | $446,600 | $109,000 | $337,600 |
| 2015 | $7,155 | $454,000 | $111,600 | $342,400 |
Source: Public Records
Map
Nearby Homes
Your Personal Tour Guide
Ask me questions while you tour the home.