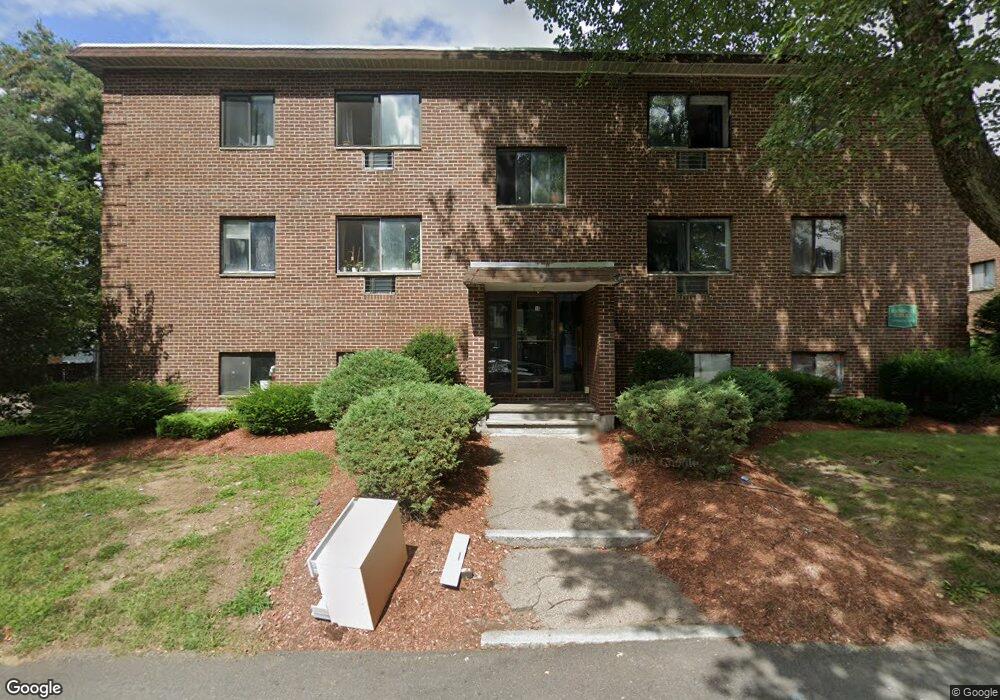
10 Kendall Ave Unit 9 Framingham, MA 01702
Estimated Value: $260,000 - $287,472
2
Beds
1
Bath
800
Sq Ft
$340/Sq Ft
Est. Value
About This Home
This home is located at 10 Kendall Ave Unit 9, Framingham, MA 01702 and is currently estimated at $272,157, approximately $340 per square foot. 10 Kendall Ave Unit 9 is a home located in Middlesex County with nearby schools including Framingham High School, Happy Hollow School, and Marian High School.
Ownership History
Date
Name
Owned For
Owner Type
Purchase Details
Closed on
Mar 11, 2010
Sold by
Bank Of New York Mello
Bought by
Lewis David B
Current Estimated Value
Purchase Details
Closed on
Feb 4, 2009
Sold by
Guidine Romeu P
Bought by
Bank Of New York
Purchase Details
Closed on
Sep 13, 2005
Sold by
Leger Ronald J G and Leger Susan A
Bought by
Guidine Romeu P
Home Financials for this Owner
Home Financials are based on the most recent Mortgage that was taken out on this home.
Original Mortgage
$144,000
Interest Rate
5.79%
Mortgage Type
Purchase Money Mortgage
Purchase Details
Closed on
Apr 13, 1990
Sold by
Ross Barry A
Bought by
Leger Ronald J
Home Financials for this Owner
Home Financials are based on the most recent Mortgage that was taken out on this home.
Original Mortgage
$60,150
Interest Rate
10.13%
Mortgage Type
Purchase Money Mortgage
Create a Home Valuation Report for This Property
The Home Valuation Report is an in-depth analysis detailing your home's value as well as a comparison with similar homes in the area
Home Values in the Area
Average Home Value in this Area
Purchase History
| Date | Buyer | Sale Price | Title Company |
|---|---|---|---|
| Lewis David B | $74,000 | -- | |
| Bank Of New York | $203,129 | -- | |
| Guidine Romeu P | $180,000 | -- | |
| Leger Ronald J | $63,000 | -- |
Source: Public Records
Mortgage History
| Date | Status | Borrower | Loan Amount |
|---|---|---|---|
| Open | Leger Ronald J | $1,000,000 | |
| Previous Owner | Guidine Romeu P | $144,000 | |
| Previous Owner | Leger Ronald J | $60,150 |
Source: Public Records
Tax History
| Year | Tax Paid | Tax Assessment Tax Assessment Total Assessment is a certain percentage of the fair market value that is determined by local assessors to be the total taxable value of land and additions on the property. | Land | Improvement |
|---|---|---|---|---|
| 2025 | $2,809 | $235,300 | $0 | $235,300 |
| 2024 | $2,476 | $198,700 | $0 | $198,700 |
| 2023 | $2,360 | $180,300 | $0 | $180,300 |
| 2022 | $2,268 | $165,100 | $0 | $165,100 |
| 2021 | $2,070 | $147,300 | $0 | $147,300 |
| 2020 | $2,090 | $139,500 | $0 | $139,500 |
| 2019 | $1,995 | $129,700 | $0 | $129,700 |
| 2018 | $1,653 | $101,300 | $0 | $101,300 |
| 2017 | $1,424 | $85,200 | $0 | $85,200 |
| 2016 | $1,481 | $85,200 | $0 | $85,200 |
| 2015 | $1,360 | $76,300 | $0 | $76,300 |
Source: Public Records
Map
Nearby Homes
- 27 Stillman St
- 150 2nd St Unit 310
- 29 Village Rock Ln Unit 6
- 23 Village Rock Ln Unit 22
- 7 Weld St Unit 50
- 7 Weld St Unit 29
- 21 Village Rock Ln Unit 4
- 9 Village Hill Ln Unit 15
- 5 Village Rock Ln Unit 24
- 52 Village Brook Ln Unit 14
- 4 Village Rock Ln Unit 9
- 11 Weld St Unit 37
- 126 Beaver St Unit 121
- 126 Beaver St Unit 5
- 34 Walden Dr Unit 5
- 8 Walden Dr Unit 13
- 4 Village Brook Ln
- 50 Village Brook Ln Unit 4
- 57 Village Brook Ln Unit 5
- 18 Beaver Ct
- 10 Kendall Ave Unit 12
- 10 Kendall Ave
- 10 Kendall Ave Unit 8
- 10 Kendall Ave Unit 7
- 10 Kendall Ave Unit 6
- 10 Kendall Ave Unit 5
- 10 Kendall Ave Unit 4
- 10 Kendall Ave Unit 3
- 10 Kendall Ave Unit 2
- 10 Kendall Ave Unit 1
- 10 Kendall Ave Unit 10
- 10 Kendall Ave Unit 10.8
- 12 Kendall Ave Unit 25
- 12 Kendall Ave Unit 24
- 12 Kendall Ave Unit 23
- 12 Kendall Ave Unit 22
- 12 Kendall Ave Unit 21
- 12 Kendall Ave Unit 20
- 12 Kendall Ave Unit 19
- 12 Kendall Ave Unit 18
Your Personal Tour Guide
Ask me questions while you tour the home.