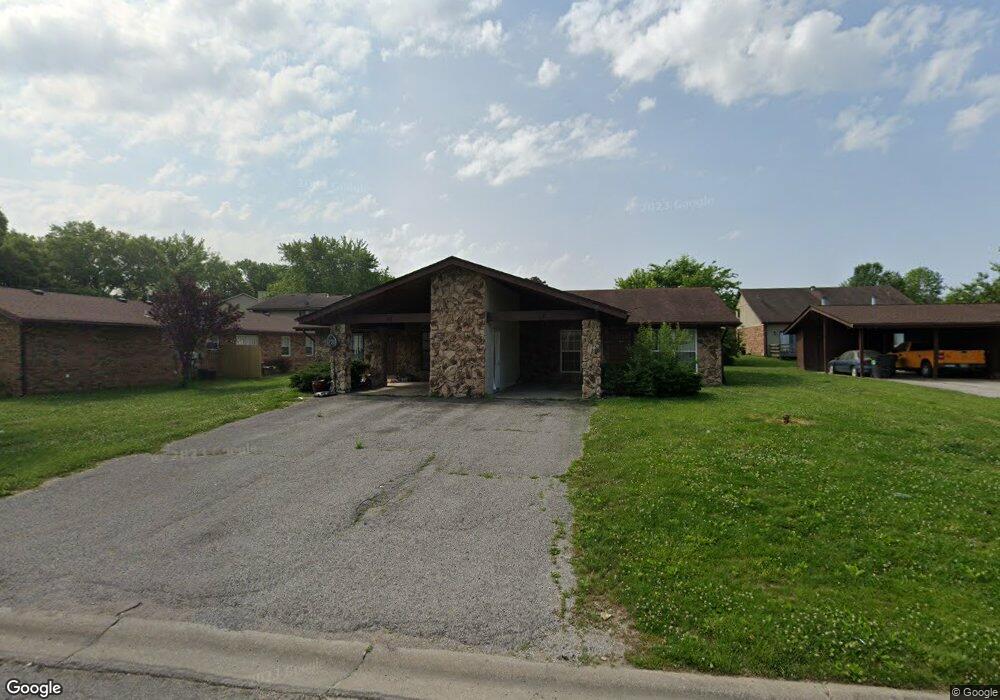
10 Kensington Heights Rd Unit 10&12 Belleville, IL 62226
Estimated Value: $117,000 - $163,000
4
Beds
--
Bath
2,100
Sq Ft
$66/Sq Ft
Est. Value
About This Home
This home is located at 10 Kensington Heights Rd Unit 10&12, Belleville, IL 62226 and is currently estimated at $138,519, approximately $65 per square foot. 10 Kensington Heights Rd Unit 10&12 is a home located in St. Clair County with nearby schools including Union Elementary School, West Jr High School, and Our Lady Queen Of Peace Catholic School.
Ownership History
Date
Name
Owned For
Owner Type
Purchase Details
Closed on
Jun 3, 2020
Sold by
Lewis Terrence A
Bought by
Garlit Gilbert C
Current Estimated Value
Home Financials for this Owner
Home Financials are based on the most recent Mortgage that was taken out on this home.
Original Mortgage
$80,250
Outstanding Balance
$71,529
Interest Rate
3.5%
Mortgage Type
New Conventional
Estimated Equity
$66,990
Purchase Details
Closed on
Mar 29, 2006
Sold by
Noble Ronald L
Bought by
Lewis Terrance A
Home Financials for this Owner
Home Financials are based on the most recent Mortgage that was taken out on this home.
Original Mortgage
$101,850
Interest Rate
6.34%
Mortgage Type
Fannie Mae Freddie Mac
Purchase Details
Closed on
Nov 15, 2005
Sold by
Noble Ronald L and Noble Janet M
Bought by
Noble Ronald L and Ronald Noble Revocable Trust
Create a Home Valuation Report for This Property
The Home Valuation Report is an in-depth analysis detailing your home's value as well as a comparison with similar homes in the area
Home Values in the Area
Average Home Value in this Area
Purchase History
| Date | Buyer | Sale Price | Title Company |
|---|---|---|---|
| Garlit Gilbert C | $107,000 | Advanced Title Solutions Inc | |
| Lewis Terrance A | $105,000 | Fatic | |
| Noble Ronald L | -- | First American Title Insuran |
Source: Public Records
Mortgage History
| Date | Status | Borrower | Loan Amount |
|---|---|---|---|
| Open | Garlit Gilbert C | $80,250 | |
| Previous Owner | Lewis Terrance A | $101,850 |
Source: Public Records
Tax History Compared to Growth
Tax History
| Year | Tax Paid | Tax Assessment Tax Assessment Total Assessment is a certain percentage of the fair market value that is determined by local assessors to be the total taxable value of land and additions on the property. | Land | Improvement |
|---|---|---|---|---|
| 2024 | $3,164 | $42,515 | $6,836 | $35,679 |
| 2023 | $2,586 | $32,784 | $6,743 | $26,041 |
| 2022 | $2,415 | $29,858 | $6,141 | $23,717 |
| 2021 | $2,387 | $28,633 | $5,889 | $22,744 |
| 2020 | $2,311 | $26,665 | $5,484 | $21,181 |
| 2019 | $2,147 | $25,372 | $5,703 | $19,669 |
| 2018 | $2,112 | $24,724 | $5,557 | $19,167 |
| 2017 | $2,074 | $24,066 | $5,409 | $18,657 |
| 2016 | $2,080 | $23,237 | $5,223 | $18,014 |
| 2014 | $2,013 | $25,362 | $6,219 | $19,143 |
| 2013 | $1,893 | $25,362 | $6,219 | $19,143 |
Source: Public Records
Map
Nearby Homes
- 11 Kingsway Dr
- 202 Liberty Dr
- 102 Kensington Heights Rd
- 128 Freedom Dr
- 22 Elizabeth Dr
- 119 Freedom Dr
- 4619 Ruth St
- 20 S 44th St
- 8 S 51st St
- 4720 Ruth St
- 2819 Frank Scott Pkwy W
- 40 Irene Dr
- 4518 Ammel St
- 44 Gatewood Ct
- 129 N 44th St
- 130 Hickory Lake
- 119 S 37th St
- 18 Jonathon Lee Dr
- 6204 Warren Dr
- 125 N 41st St
- 10 Kensington Heights Rd
- 8 Kensington Heights Rd
- 14 Kensington Heights Rd
- 6 Kensington Heights Rd
- 9 Kingsway Dr
- 7 Kingsway Dr
- 5 Kingsway Dr
- 4 Kensington Heights Rd
- 18 Kensington Heights Rd
- 2 Kensington Heights Rd
- 19 Kingsway Dr
- 3 Kingsway Dr
- 11 Kensington Heights Rd
- 1 Kingsway Dr
- 24 Kensington Heights Rd
- 22 Kensington Heights Rd Unit 22 & 24
- 22 Kensington Heights Rd
- 156 Marion Dr Unit 2
- 156 Marion Dr