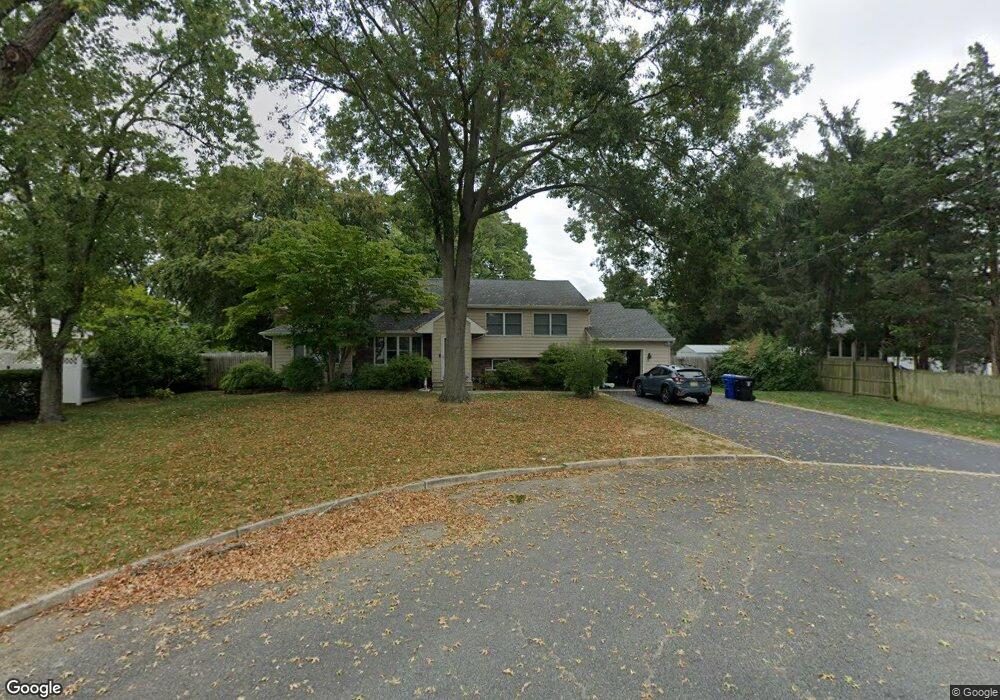
10 Kevan Place Middletown, NJ 07748
New Monmouth NeighborhoodEstimated Value: $729,000 - $849,000
4
Beds
3
Baths
2,281
Sq Ft
$344/Sq Ft
Est. Value
About This Home
This home is located at 10 Kevan Place, Middletown, NJ 07748 and is currently estimated at $785,496, approximately $344 per square foot. 10 Kevan Place is a home located in Monmouth County with nearby schools including New Monmouth Elementary School, Thorne Middle School, and Middletown High School North.
Ownership History
Date
Name
Owned For
Owner Type
Purchase Details
Closed on
Nov 30, 2006
Sold by
Obrien David J
Bought by
Kolk Dennis and Kolk Linda
Current Estimated Value
Home Financials for this Owner
Home Financials are based on the most recent Mortgage that was taken out on this home.
Original Mortgage
$374,000
Outstanding Balance
$224,102
Interest Rate
6.35%
Mortgage Type
Purchase Money Mortgage
Estimated Equity
$561,394
Purchase Details
Closed on
May 22, 1998
Sold by
Maul Jerry
Bought by
O'Brien David and O'Brien Lorrie
Home Financials for this Owner
Home Financials are based on the most recent Mortgage that was taken out on this home.
Original Mortgage
$115,000
Interest Rate
7.12%
Mortgage Type
Purchase Money Mortgage
Create a Home Valuation Report for This Property
The Home Valuation Report is an in-depth analysis detailing your home's value as well as a comparison with similar homes in the area
Home Values in the Area
Average Home Value in this Area
Purchase History
| Date | Buyer | Sale Price | Title Company |
|---|---|---|---|
| Kolk Dennis | $440,000 | -- | |
| O'Brien David | $227,000 | -- |
Source: Public Records
Mortgage History
| Date | Status | Borrower | Loan Amount |
|---|---|---|---|
| Open | Kolk Dennis | $374,000 | |
| Previous Owner | O'Brien David | $115,000 |
Source: Public Records
Tax History Compared to Growth
Tax History
| Year | Tax Paid | Tax Assessment Tax Assessment Total Assessment is a certain percentage of the fair market value that is determined by local assessors to be the total taxable value of land and additions on the property. | Land | Improvement |
|---|---|---|---|---|
| 2025 | $9,821 | $652,300 | $395,000 | $257,300 |
| 2024 | $8,313 | $597,000 | $344,400 | $252,600 |
| 2023 | $8,313 | $478,300 | $285,100 | $193,200 |
| 2022 | $7,675 | $421,700 | $238,500 | $183,200 |
| 2021 | $7,675 | $369,000 | $206,000 | $163,000 |
| 2020 | $7,904 | $369,700 | $199,100 | $170,600 |
| 2019 | $7,787 | $368,700 | $199,100 | $169,600 |
| 2018 | $7,634 | $352,300 | $190,600 | $161,700 |
| 2017 | $7,338 | $345,500 | $190,600 | $154,900 |
| 2016 | $7,280 | $341,600 | $190,600 | $151,000 |
| 2015 | $7,292 | $341,400 | $190,600 | $150,800 |
| 2014 | $7,189 | $328,400 | $190,600 | $137,800 |
Source: Public Records
Map
Nearby Homes