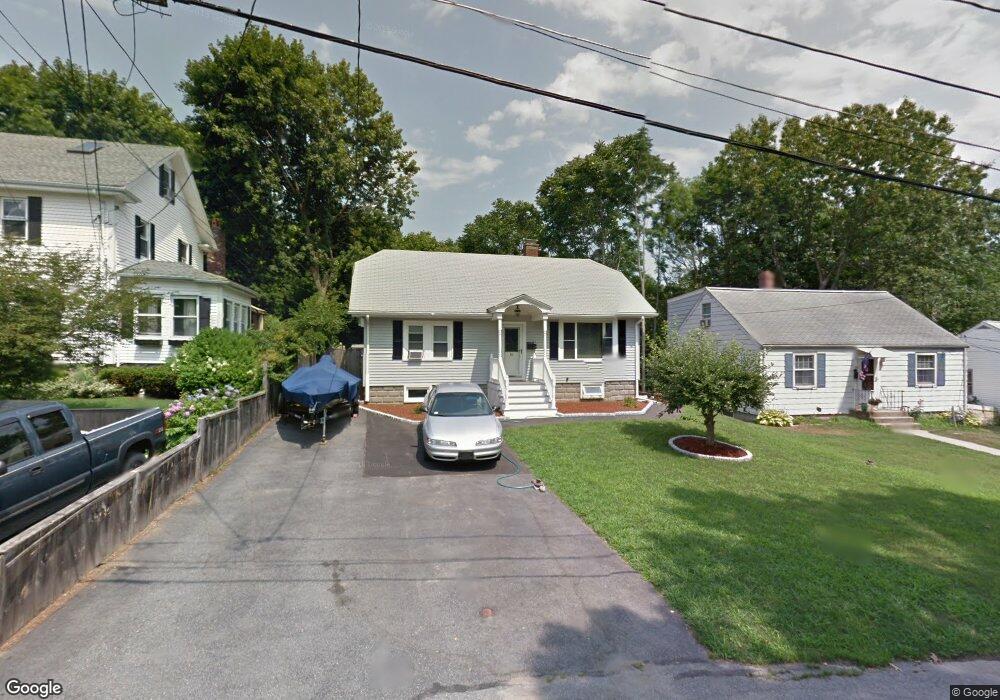
10 Kimball Rd Woburn, MA 01801
Downtown Woburn NeighborhoodEstimated Value: $638,000 - $726,000
4
Beds
2
Baths
1,244
Sq Ft
$550/Sq Ft
Est. Value
About This Home
This home is located at 10 Kimball Rd, Woburn, MA 01801 and is currently estimated at $684,590, approximately $550 per square foot. 10 Kimball Rd is a home located in Middlesex County with nearby schools including Wyman Elementary School, John F. Kennedy Middle School, and Woburn High School.
Ownership History
Date
Name
Owned For
Owner Type
Purchase Details
Closed on
Jun 25, 2024
Sold by
Follansbee Gregg A and Follansbee Shawn
Bought by
Follansbee Gregg A and Follansbee Shawn M
Current Estimated Value
Home Financials for this Owner
Home Financials are based on the most recent Mortgage that was taken out on this home.
Original Mortgage
$196,000
Outstanding Balance
$193,636
Interest Rate
6.94%
Mortgage Type
Stand Alone Refi Refinance Of Original Loan
Estimated Equity
$490,954
Purchase Details
Closed on
Feb 7, 2022
Sold by
Follansbee Gregg A
Bought by
Follansbee Shawn
Purchase Details
Closed on
Jun 30, 1994
Sold by
Green Patricia E and Kassiotis Angela V
Bought by
Follansbee Gregg A and Follansbee Kimberly A
Home Financials for this Owner
Home Financials are based on the most recent Mortgage that was taken out on this home.
Original Mortgage
$130,400
Interest Rate
8.55%
Mortgage Type
Purchase Money Mortgage
Purchase Details
Closed on
Nov 5, 1987
Sold by
Polacke Nrman L
Bought by
Green Patricia E
Home Financials for this Owner
Home Financials are based on the most recent Mortgage that was taken out on this home.
Original Mortgage
$138,000
Interest Rate
10.97%
Mortgage Type
Purchase Money Mortgage
Create a Home Valuation Report for This Property
The Home Valuation Report is an in-depth analysis detailing your home's value as well as a comparison with similar homes in the area
Home Values in the Area
Average Home Value in this Area
Purchase History
| Date | Buyer | Sale Price | Title Company |
|---|---|---|---|
| Follansbee Gregg A | -- | None Available | |
| Follansbee Gregg A | -- | None Available | |
| Follansbee Shawn | -- | None Available | |
| Follansbee Shawn | -- | None Available | |
| Follansbee Shawn | -- | None Available | |
| Follansbee Gregg A | $163,000 | -- | |
| Green Patricia E | $172,500 | -- |
Source: Public Records
Mortgage History
| Date | Status | Borrower | Loan Amount |
|---|---|---|---|
| Open | Follansbee Gregg A | $196,000 | |
| Closed | Follansbee Gregg A | $196,000 | |
| Previous Owner | Green Patricia E | $21,600 | |
| Previous Owner | Green Patricia E | $130,400 | |
| Previous Owner | Green Patricia E | $138,000 | |
| Previous Owner | Green Patricia E | $28,000 |
Source: Public Records
Tax History Compared to Growth
Tax History
| Year | Tax Paid | Tax Assessment Tax Assessment Total Assessment is a certain percentage of the fair market value that is determined by local assessors to be the total taxable value of land and additions on the property. | Land | Improvement |
|---|---|---|---|---|
| 2025 | $4,999 | $585,400 | $321,900 | $263,500 |
| 2024 | $4,595 | $570,100 | $306,600 | $263,500 |
| 2023 | $4,641 | $533,500 | $278,800 | $254,700 |
| 2022 | $4,525 | $484,500 | $242,400 | $242,100 |
| 2021 | $4,270 | $457,700 | $230,800 | $226,900 |
| 2020 | $4,019 | $431,200 | $230,800 | $200,400 |
| 2019 | $3,843 | $404,500 | $219,800 | $184,700 |
| 2018 | $3,656 | $369,700 | $201,700 | $168,000 |
| 2017 | $3,530 | $355,100 | $192,100 | $163,000 |
| 2016 | $3,366 | $334,900 | $179,500 | $155,400 |
| 2015 | $3,236 | $318,200 | $167,800 | $150,400 |
| 2014 | $3,042 | $291,400 | $167,800 | $123,600 |
Source: Public Records
Map
Nearby Homes
- 18 Hamilton Rd
- 8 Clinton St
- 462 Place Ln
- 166 Place Ln Unit 166
- 168 Place Ln
- 0 Fryeburg Rd
- 12 Mishawum Rd
- 38 Middle St
- 602 Main St Unit 1
- 52 Middle St
- 17 Wright St
- 37 1/2 Chestnut St
- 846 Main St
- 14 Church Ave
- 14 Church Ave Unit 2
- 20 Barbara Cir
- 6 Callahan Dr
- 16 Sunnyside Rd
- 18 Church St Unit 2
- 26 Flagg St