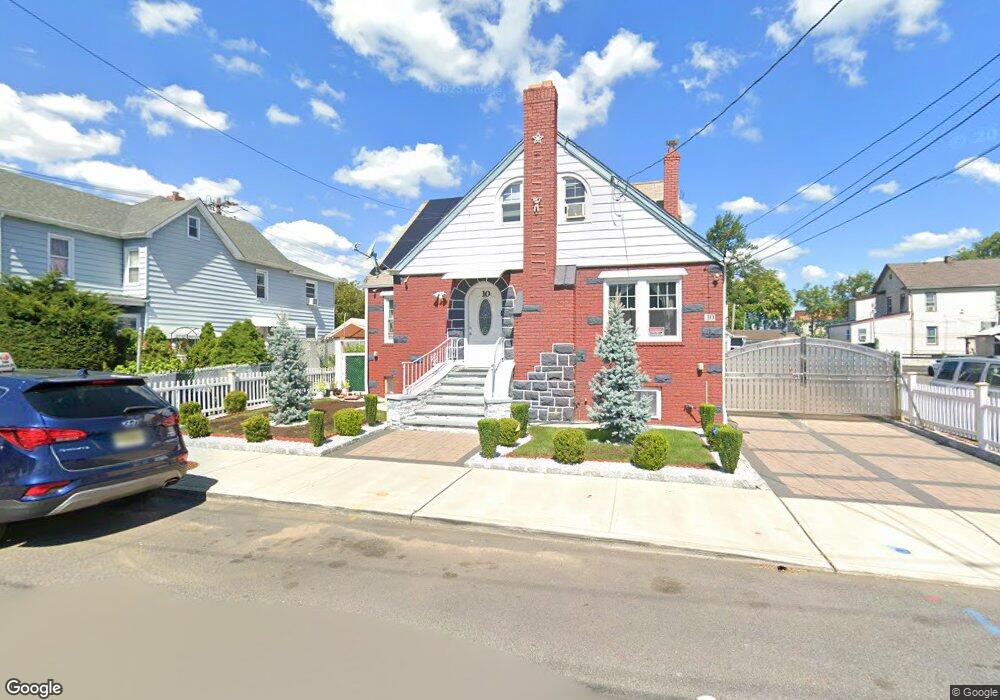
10 Lafayette St Hackensack, NJ 07601
Estimated Value: $535,000 - $772,000
Studio
--
Bath
1,763
Sq Ft
$357/Sq Ft
Est. Value
About This Home
This home is located at 10 Lafayette St, Hackensack, NJ 07601 and is currently estimated at $628,920, approximately $356 per square foot. 10 Lafayette St is a home located in Bergen County with nearby schools including Hackensack High School and George Washington School.
Ownership History
Date
Name
Owned For
Owner Type
Purchase Details
Closed on
Feb 12, 2020
Sold by
Polanco Mircos and Arvelo Hannoy
Bought by
Marca Mayra E and Marca Carlos
Current Estimated Value
Home Financials for this Owner
Home Financials are based on the most recent Mortgage that was taken out on this home.
Original Mortgage
$279,837
Outstanding Balance
$247,302
Interest Rate
3.5%
Mortgage Type
FHA
Estimated Equity
$381,618
Purchase Details
Closed on
Jun 8, 2001
Sold by
Urrego Herman
Bought by
Polanco Marcos and Polanco Fernando
Home Financials for this Owner
Home Financials are based on the most recent Mortgage that was taken out on this home.
Original Mortgage
$198,000
Interest Rate
7.08%
Purchase Details
Closed on
Jul 6, 1994
Sold by
Estate Of Anthony Sanzari
Bought by
Urrego Herman and Urrego Bricedida
Home Financials for this Owner
Home Financials are based on the most recent Mortgage that was taken out on this home.
Original Mortgage
$131,000
Interest Rate
8.51%
Create a Home Valuation Report for This Property
The Home Valuation Report is an in-depth analysis detailing your home's value as well as a comparison with similar homes in the area
Home Values in the Area
Average Home Value in this Area
Purchase History
| Date | Buyer | Sale Price | Title Company |
|---|---|---|---|
| Marca Mayra E | $285,000 | Chicago Title Insurance Co | |
| Polanco Marcos | $220,000 | -- | |
| Urrego Herman | $154,000 | -- |
Source: Public Records
Mortgage History
| Date | Status | Borrower | Loan Amount |
|---|---|---|---|
| Open | Marca Mayra E | $279,837 | |
| Previous Owner | Polanco Marcos | $198,000 | |
| Previous Owner | Urrego Herman | $131,000 |
Source: Public Records
Tax History
| Year | Tax Paid | Tax Assessment Tax Assessment Total Assessment is a certain percentage of the fair market value that is determined by local assessors to be the total taxable value of land and additions on the property. | Land | Improvement |
|---|---|---|---|---|
| 2025 | $11,054 | $361,700 | $132,000 | $229,700 |
| 2024 | $10,413 | $361,700 | $132,000 | $229,700 |
| 2023 | $9,939 | $361,700 | $132,000 | $229,700 |
| 2022 | $9,939 | $354,700 | $126,400 | $228,300 |
| 2021 | $9,584 | $285,400 | $104,200 | $181,200 |
| 2020 | $9,444 | $285,400 | $104,200 | $181,200 |
| 2019 | $9,443 | $281,300 | $102,900 | $178,400 |
| 2018 | $9,471 | $277,500 | $100,600 | $176,900 |
| 2017 | $9,337 | $273,400 | $99,300 | $174,100 |
| 2016 | $8,985 | $266,000 | $94,800 | $171,200 |
| 2015 | $8,701 | $248,600 | $140,000 | $108,600 |
| 2014 | $8,258 | $248,600 | $140,000 | $108,600 |
Source: Public Records
Map
Nearby Homes
- 62 Frederick St Unit 1
- 337 Hudson St
- 84 Kansas St
- 9 Vreeland Ave Unit 3A
- 99 Kansas St
- 115 River Rd
- 113 Kansas St
- 115 Kansas St
- 65 Mcdougall Ln
- 235 Larch Ave
- 467 Hudson St
- 38 Chestnut Ave
- 33 Beechwood Ave
- 74 Union St
- 255 Elm Ave
- 75 Union St Unit 5E
- 290 Elm Ave
- 53 Elmwood Ave
- 79 Beechwood Ave
- 228 Ridgefield Ave
- 16 Lafayette St
- 201 Hudson St
- 192 Washington Ave
- 190 Washington Ave Unit 2
- 190 Washington Ave Unit 1
- 190 Washington Ave
- 187 Hudson St
- 13 Lafayette St
- 186 Washington Ave
- 197 Washington Ave
- 191 Washington Ave Unit 93
- 185 Hudson St Unit 1
- 185 Hudson St
- 185 Hudson St Unit 1st Floor
- 185 Hudson St Unit 2
- 199 Washington Ave Unit 203
- 184 Washington Ave
- 207 Washington Ave
- 216 Washington Ave
- 181 Hudson St
Your Personal Tour Guide
Ask me questions while you tour the home.