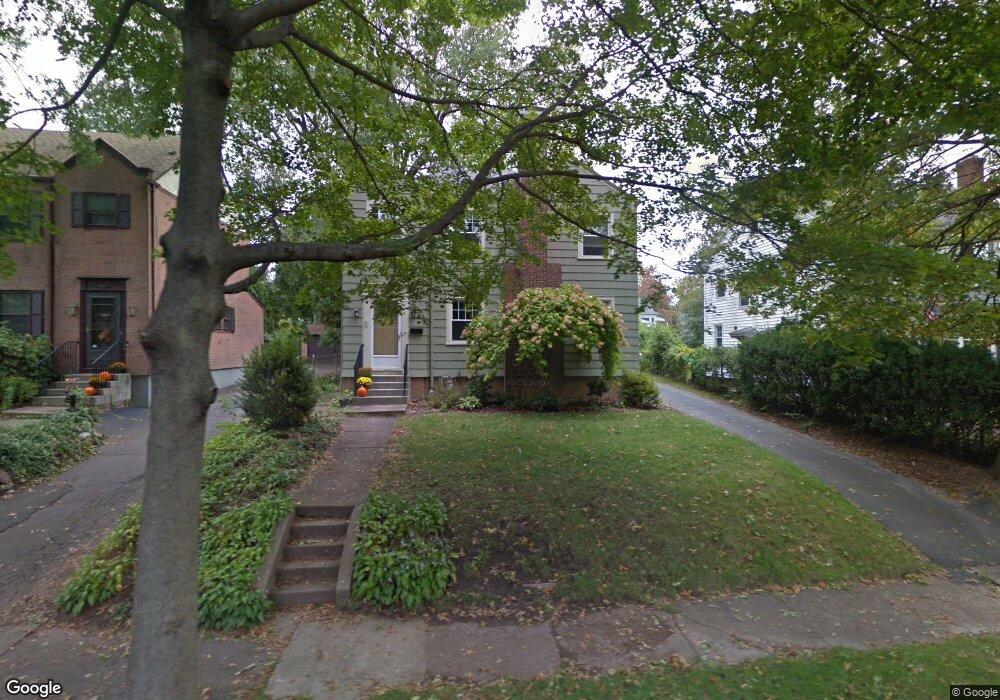
10 Lansdowne Ave Hamden, CT 06517
Estimated Value: $398,000 - $475,000
4
Beds
1
Bath
1,760
Sq Ft
$254/Sq Ft
Est. Value
About This Home
This home is located at 10 Lansdowne Ave, Hamden, CT 06517 and is currently estimated at $446,828, approximately $253 per square foot. 10 Lansdowne Ave is a home located in New Haven County with nearby schools including Hamden Middle School, Hamden High School, and St Rita School.
Ownership History
Date
Name
Owned For
Owner Type
Purchase Details
Closed on
Mar 8, 2021
Sold by
Shea Carrie A
Bought by
Clark Ian H and Shea Carrie A
Current Estimated Value
Purchase Details
Closed on
Jun 21, 2013
Sold by
Lamothe Peter T
Bought by
Shea Carrie A
Home Financials for this Owner
Home Financials are based on the most recent Mortgage that was taken out on this home.
Original Mortgage
$240,000
Interest Rate
3.45%
Purchase Details
Closed on
Apr 1, 2008
Sold by
Grady William E and Grady Hilda C
Bought by
Lamothe Peter T and Lamothe Carrie S
Home Financials for this Owner
Home Financials are based on the most recent Mortgage that was taken out on this home.
Original Mortgage
$227,200
Interest Rate
5.76%
Create a Home Valuation Report for This Property
The Home Valuation Report is an in-depth analysis detailing your home's value as well as a comparison with similar homes in the area
Home Values in the Area
Average Home Value in this Area
Purchase History
| Date | Buyer | Sale Price | Title Company |
|---|---|---|---|
| Clark Ian H | -- | None Available | |
| Shea Carrie A | -- | -- | |
| Lamothe Peter T | $284,000 | -- |
Source: Public Records
Mortgage History
| Date | Status | Borrower | Loan Amount |
|---|---|---|---|
| Previous Owner | Lamothe Peter T | $240,000 | |
| Previous Owner | Lamothe Peter T | $227,200 | |
| Previous Owner | Lamothe Peter T | $32,800 |
Source: Public Records
Tax History
| Year | Tax Paid | Tax Assessment Tax Assessment Total Assessment is a certain percentage of the fair market value that is determined by local assessors to be the total taxable value of land and additions on the property. | Land | Improvement |
|---|---|---|---|---|
| 2025 | $13,680 | $263,690 | $91,000 | $172,690 |
| 2024 | $9,195 | $165,340 | $50,120 | $115,220 |
| 2023 | $9,298 | $164,920 | $50,120 | $114,800 |
| 2022 | $9,150 | $164,920 | $50,120 | $114,800 |
| 2021 | $8,648 | $164,920 | $50,120 | $114,800 |
| 2020 | $9,682 | $186,270 | $94,010 | $92,260 |
| 2019 | $9,101 | $186,270 | $94,010 | $92,260 |
| 2018 | $8,934 | $186,270 | $94,010 | $92,260 |
| 2017 | $8,431 | $186,270 | $94,010 | $92,260 |
| 2016 | $8,449 | $186,270 | $94,010 | $92,260 |
| 2015 | $8,277 | $202,510 | $104,440 | $98,070 |
| 2014 | $8,086 | $202,510 | $104,440 | $98,070 |
Source: Public Records
Map
Nearby Homes
- 124 Churchill Rd
- 59 Broadfield Rd
- 1060 Ridge Rd
- 1085 Ridge Rd
- 35 Barrett St
- 73 Woodlawn St
- 36 Ford St
- 669 Hartford Turnpike
- 52 Coram St
- 30 Coram St
- 5 van Rose Dr
- 520 Hartford Turnpike
- 11 Dadio Rd
- 86 Lent Rd
- 15 Townline Rd
- 114 Daniel Rd
- 1414 Whitney Ave Unit E3
- 1412 Whitney Ave Unit J1
- 42 Carroll Rd
- 200 Foote St
- 18 Lansdowne Ave
- 4 Lansdowne Ave
- 20 Spring Garden St
- 24 Spring Garden St
- 26 Lansdowne Ave
- 111 Swarthmore St
- 137 Santa fe Ave
- 143 Santa fe Ave
- 127 Santa fe Ave
- 32 Lansdowne Ave
- 149 Santa fe Ave
- 30 Spring Garden St
- 105 Swarthmore St
- 19 Lansdowne Ave
- 21 Spring Garden St
- 123 Santa fe Ave
- 157 Santa fe Ave
- 36 Lansdowne Ave
- 25 Lansdowne Ave
- 36 Spring Garden St
Your Personal Tour Guide
Ask me questions while you tour the home.