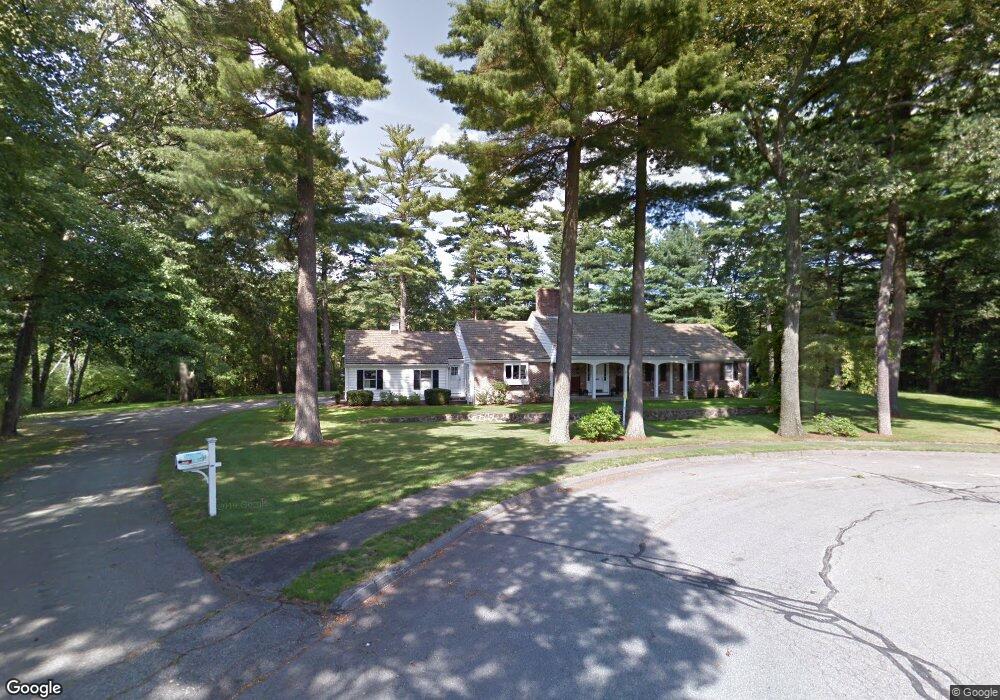
10 Lantern Ln Lynnfield, MA 01940
Estimated Value: $1,064,000 - $1,372,000
3
Beds
2
Baths
2,154
Sq Ft
$564/Sq Ft
Est. Value
About This Home
This home is located at 10 Lantern Ln, Lynnfield, MA 01940 and is currently estimated at $1,214,279, approximately $563 per square foot. 10 Lantern Ln is a home located in Essex County with nearby schools including Pickering Middle School, Lynnfield High School, and Our Lady Of Assumption School.
Ownership History
Date
Name
Owned For
Owner Type
Purchase Details
Closed on
Jul 31, 1997
Sold by
Kidder Nt
Bought by
Claflin Jean S and Claflin Mark
Current Estimated Value
Home Financials for this Owner
Home Financials are based on the most recent Mortgage that was taken out on this home.
Original Mortgage
$160,000
Outstanding Balance
$24,003
Interest Rate
7.55%
Mortgage Type
Purchase Money Mortgage
Estimated Equity
$1,190,276
Purchase Details
Closed on
Apr 12, 1994
Sold by
Kidder Constance E
Bought by
Kidder Nt
Home Financials for this Owner
Home Financials are based on the most recent Mortgage that was taken out on this home.
Original Mortgage
$300,000
Interest Rate
7.27%
Mortgage Type
Purchase Money Mortgage
Create a Home Valuation Report for This Property
The Home Valuation Report is an in-depth analysis detailing your home's value as well as a comparison with similar homes in the area
Home Values in the Area
Average Home Value in this Area
Purchase History
| Date | Buyer | Sale Price | Title Company |
|---|---|---|---|
| Claflin Jean S | $320,000 | -- | |
| Kidder Nt | $315,000 | -- |
Source: Public Records
Mortgage History
| Date | Status | Borrower | Loan Amount |
|---|---|---|---|
| Open | Kidder Nt | $160,000 | |
| Previous Owner | Kidder Nt | $300,000 |
Source: Public Records
Tax History Compared to Growth
Tax History
| Year | Tax Paid | Tax Assessment Tax Assessment Total Assessment is a certain percentage of the fair market value that is determined by local assessors to be the total taxable value of land and additions on the property. | Land | Improvement |
|---|---|---|---|---|
| 2025 | $11,877 | $1,124,700 | $705,500 | $419,200 |
| 2024 | $11,058 | $1,052,100 | $659,400 | $392,700 |
| 2023 | $11,171 | $988,600 | $625,400 | $363,200 |
| 2022 | $11,188 | $933,100 | $616,900 | $316,200 |
| 2021 | $10,235 | $771,300 | $468,200 | $303,100 |
| 2020 | $10,159 | $729,800 | $425,700 | $304,100 |
| 2019 | $10,152 | $729,800 | $425,700 | $304,100 |
| 2018 | $9,819 | $713,600 | $425,700 | $287,900 |
| 2017 | $9,745 | $707,200 | $419,300 | $287,900 |
| 2016 | $9,016 | $621,800 | $351,400 | $270,400 |
| 2015 | $8,814 | $608,300 | $350,900 | $257,400 |
Source: Public Records
Map
Nearby Homes