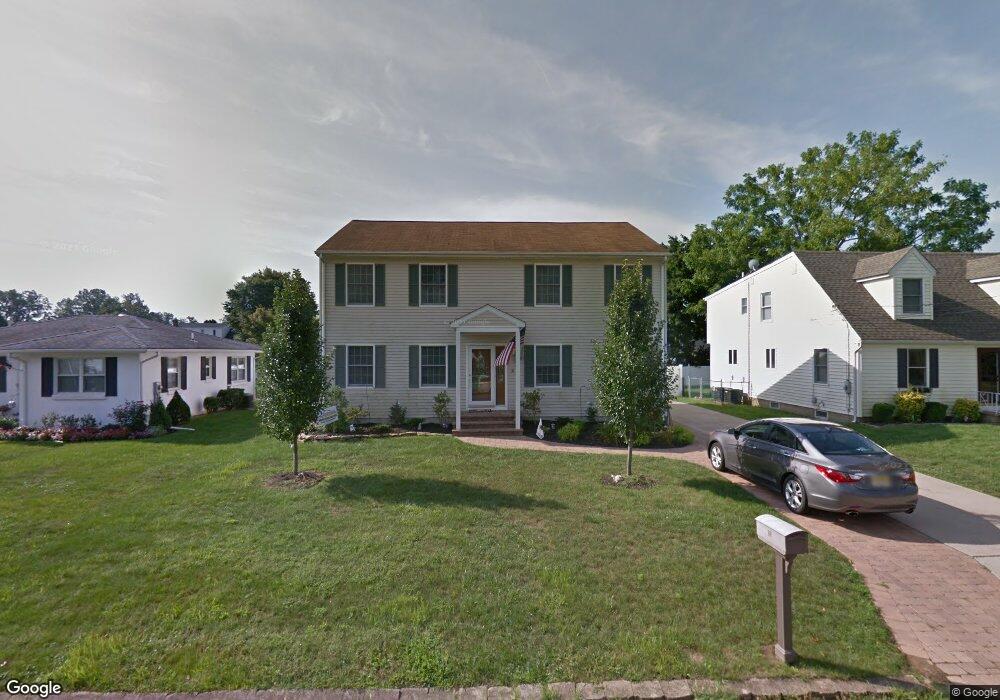
10 Laurel Ave Bordentown, NJ 08505
Estimated Value: $484,000 - $635,000
3
Beds
3
Baths
2,300
Sq Ft
$238/Sq Ft
Est. Value
About This Home
This home is located at 10 Laurel Ave, Bordentown, NJ 08505 and is currently estimated at $547,804, approximately $238 per square foot. 10 Laurel Ave is a home located in Burlington County with nearby schools including Bordentown Reg High School and St Raphael School.
Ownership History
Date
Name
Owned For
Owner Type
Purchase Details
Closed on
Dec 11, 2009
Sold by
Dombrowski Steven and Dombrowski Lisa C
Bought by
Lipcsey Diane M
Current Estimated Value
Home Financials for this Owner
Home Financials are based on the most recent Mortgage that was taken out on this home.
Original Mortgage
$200,000
Outstanding Balance
$129,055
Interest Rate
4.85%
Mortgage Type
New Conventional
Estimated Equity
$418,749
Create a Home Valuation Report for This Property
The Home Valuation Report is an in-depth analysis detailing your home's value as well as a comparison with similar homes in the area
Home Values in the Area
Average Home Value in this Area
Purchase History
| Date | Buyer | Sale Price | Title Company |
|---|---|---|---|
| Lipcsey Diane M | $279,000 | Trident Abstract Title Agenc |
Source: Public Records
Mortgage History
| Date | Status | Borrower | Loan Amount |
|---|---|---|---|
| Open | Lipcsey Diane M | $200,000 |
Source: Public Records
Tax History Compared to Growth
Tax History
| Year | Tax Paid | Tax Assessment Tax Assessment Total Assessment is a certain percentage of the fair market value that is determined by local assessors to be the total taxable value of land and additions on the property. | Land | Improvement |
|---|---|---|---|---|
| 2025 | $10,403 | $270,700 | $81,400 | $189,300 |
| 2024 | $9,466 | $270,700 | $81,400 | $189,300 |
| 2023 | $9,466 | $270,700 | $81,400 | $189,300 |
| 2022 | $9,453 | $270,700 | $81,400 | $189,300 |
| 2021 | $9,439 | $270,700 | $81,400 | $189,300 |
| 2020 | $9,707 | $270,700 | $81,400 | $189,300 |
| 2019 | $9,483 | $270,700 | $81,400 | $189,300 |
| 2018 | $9,339 | $270,700 | $81,400 | $189,300 |
| 2017 | $9,169 | $270,700 | $81,400 | $189,300 |
| 2016 | $8,960 | $270,700 | $81,400 | $189,300 |
| 2015 | $8,673 | $270,700 | $81,400 | $189,300 |
| 2014 | $8,275 | $270,700 | $81,400 | $189,300 |
Source: Public Records
Map
Nearby Homes