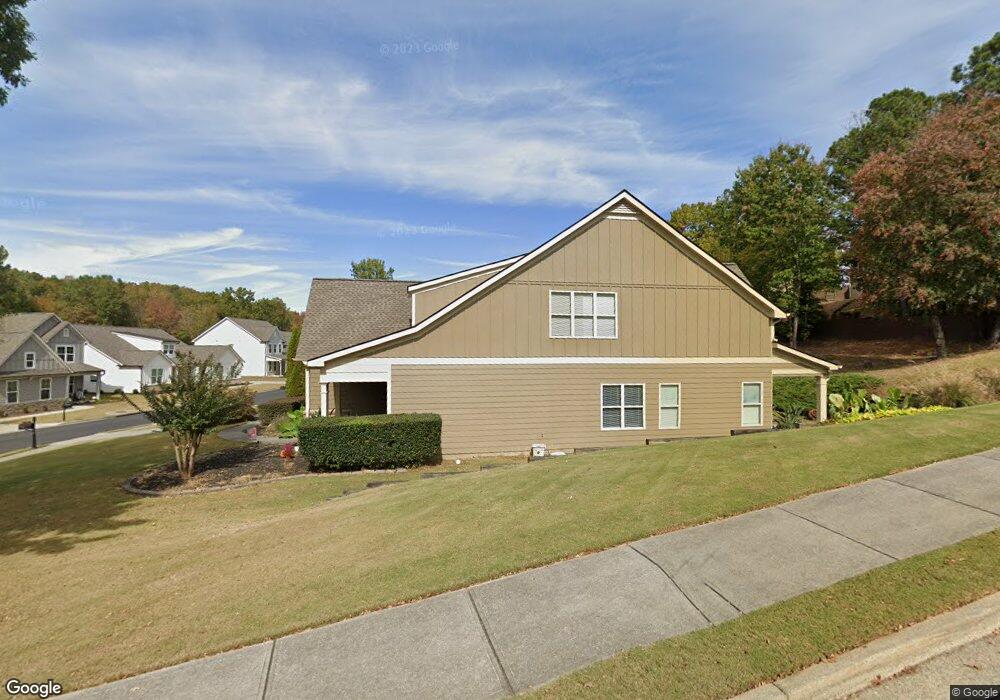
10 Laurelwood Ln NW Cartersville, GA 30121
Estimated Value: $484,819 - $521,000
4
Beds
3
Baths
2,693
Sq Ft
$187/Sq Ft
Est. Value
About This Home
This home is located at 10 Laurelwood Ln NW, Cartersville, GA 30121 and is currently estimated at $504,705, approximately $187 per square foot. 10 Laurelwood Ln NW is a home located in Bartow County with nearby schools including White Elementary School, Cass Middle School, and Cass High School.
Ownership History
Date
Name
Owned For
Owner Type
Purchase Details
Closed on
Nov 20, 2009
Sold by
Georgia Bank
Bought by
Stallings Fredrick L
Current Estimated Value
Home Financials for this Owner
Home Financials are based on the most recent Mortgage that was taken out on this home.
Original Mortgage
$162,011
Outstanding Balance
$105,679
Interest Rate
4.98%
Mortgage Type
FHA
Estimated Equity
$399,026
Purchase Details
Closed on
Oct 11, 2007
Sold by
Steve Hatley Building Co I
Bought by
Hatley J Steve
Home Financials for this Owner
Home Financials are based on the most recent Mortgage that was taken out on this home.
Original Mortgage
$188,250
Interest Rate
6.26%
Mortgage Type
New Conventional
Purchase Details
Closed on
May 18, 2005
Sold by
Mountain Brook Development
Bought by
Steve Hatley Homes Inc
Purchase Details
Closed on
May 12, 2005
Sold by
Mountain Brook Development
Bought by
Steve Hatley Homes Inc
Create a Home Valuation Report for This Property
The Home Valuation Report is an in-depth analysis detailing your home's value as well as a comparison with similar homes in the area
Home Values in the Area
Average Home Value in this Area
Purchase History
| Date | Buyer | Sale Price | Title Company |
|---|---|---|---|
| Stallings Fredrick L | $165,000 | -- | |
| Hatley J Steve | -- | -- | |
| Steve Hatley Homes Inc | $1,300,000 | -- | |
| Steve Hatley Homes Inc | $1,300,000 | -- |
Source: Public Records
Mortgage History
| Date | Status | Borrower | Loan Amount |
|---|---|---|---|
| Open | Stallings Fredrick L | $162,011 | |
| Previous Owner | Hatley J Steve | $188,250 |
Source: Public Records
Tax History Compared to Growth
Tax History
| Year | Tax Paid | Tax Assessment Tax Assessment Total Assessment is a certain percentage of the fair market value that is determined by local assessors to be the total taxable value of land and additions on the property. | Land | Improvement |
|---|---|---|---|---|
| 2024 | $4,781 | $203,153 | $32,600 | $170,553 |
| 2023 | $4,781 | $201,598 | $32,600 | $168,998 |
| 2022 | $3,917 | $160,832 | $20,000 | $140,832 |
| 2021 | $3,143 | $124,438 | $20,000 | $104,438 |
| 2020 | $3,006 | $114,438 | $10,000 | $104,438 |
| 2019 | $2,912 | $109,898 | $10,000 | $99,898 |
| 2018 | $2,698 | $101,827 | $10,000 | $91,827 |
| 2017 | $2,711 | $101,827 | $10,000 | $91,827 |
| 2016 | $2,195 | $82,800 | $10,000 | $72,800 |
| 2015 | $2,052 | $77,600 | $10,000 | $67,600 |
| 2014 | -- | $59,680 | $3,600 | $56,080 |
| 2013 | -- | $59,680 | $3,600 | $56,080 |
Source: Public Records
Map
Nearby Homes
- 34 Mountainbrook Dr
- 15 Lakeside Way
- 26 Brookside Way NW
- 25 Running Terrace Way
- 17 Ridgeline Way NW
- 37 Brookside Way NW
- 10 Parkside View NW
- 15 Parkside View
- 0 Lewis Rd NW Unit 10573789
- 76 Vaughn Rd NE
- 11 Honeylocust Ct NE
- 21 Chestnut Ridge Dr NE
- 999 Grassdale Rd NW
- 75 Willow Bend Dr NW
- 30 Saddle Ln NW
- 28 Greystone Ln NW
- 12 Ivy Chase Way NW
- 13 Greystone Ln NW
- 14 Laurelwood Ln NW
- 29 Mountainbrook Dr NW
- 29 Mountainbrook Dr NW
- 29 Mountainbrook Dr NW
- 28 Mountainbrook Dr NW
- 13 Knollwood Way NW
- 32 Mountainbrook Dr
- 16 Laurelwood Ln NW
- L250 Mountainbrook
- L249 Mountainbrook
- Lot249 Mountainbrook
- 10 Running Terrace Way
- 13 Brookside Way NW
- 13 Laurelwood Ln
- 15 Knollwood Way NW
- 33 Mountainbrook Dr NW
- 0 Laurelwood Ln Unit 7598446
- 0 Laurelwood Ln Unit 7502036
- 0 Laurelwood Ln Unit 7300989
- 0 Laurelwood Ln Unit 8903284