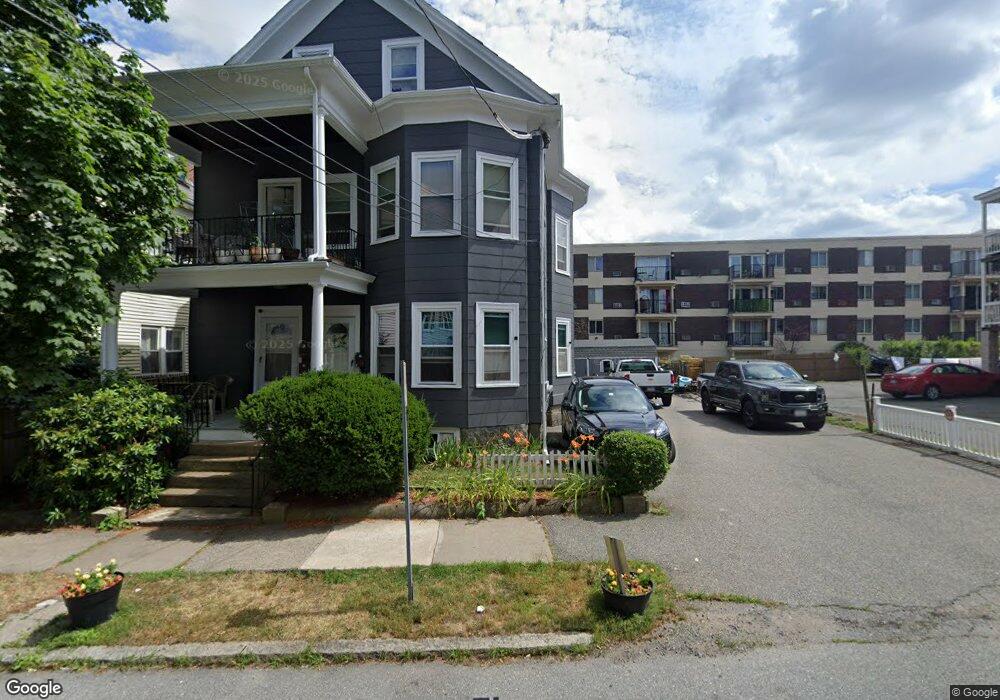
10 Leach St Salem, MA 01970
South Salem NeighborhoodEstimated Value: $648,551 - $1,041,000
7
Beds
2
Baths
3,726
Sq Ft
$243/Sq Ft
Est. Value
About This Home
This home is located at 10 Leach St, Salem, MA 01970 and is currently estimated at $906,638, approximately $243 per square foot. 10 Leach St is a home located in Essex County with nearby schools including Saltonstall School, Carlton Elementary School, and Bates Elementary School.
Ownership History
Date
Name
Owned For
Owner Type
Purchase Details
Closed on
May 26, 2015
Sold by
Moore Scott W
Bought by
Moore Scott W and Eline Laurie
Current Estimated Value
Purchase Details
Closed on
Nov 19, 1998
Sold by
Leblanc Raymond G and Leblanc Raymond G
Bought by
Moore Scott W
Create a Home Valuation Report for This Property
The Home Valuation Report is an in-depth analysis detailing your home's value as well as a comparison with similar homes in the area
Home Values in the Area
Average Home Value in this Area
Purchase History
| Date | Buyer | Sale Price | Title Company |
|---|---|---|---|
| Moore Scott W | -- | -- | |
| Moore Scott W | $162,000 | -- |
Source: Public Records
Mortgage History
| Date | Status | Borrower | Loan Amount |
|---|---|---|---|
| Previous Owner | Moore Scott W | $304,232 | |
| Previous Owner | Moore Scott W | $300,000 | |
| Previous Owner | Moore Scott W | $10,000 | |
| Previous Owner | Moore Scott W | $200,000 |
Source: Public Records
Tax History
| Year | Tax Paid | Tax Assessment Tax Assessment Total Assessment is a certain percentage of the fair market value that is determined by local assessors to be the total taxable value of land and additions on the property. | Land | Improvement |
|---|---|---|---|---|
| 2025 | $8,901 | $784,900 | $204,800 | $580,100 |
| 2024 | $8,190 | $704,800 | $194,600 | $510,200 |
| 2023 | $7,923 | $633,300 | $179,600 | $453,700 |
| 2022 | $7,257 | $547,700 | $173,700 | $374,000 |
| 2021 | $6,943 | $503,100 | $161,700 | $341,400 |
| 2020 | $6,251 | $432,600 | $152,700 | $279,900 |
| 2019 | $6,188 | $409,800 | $144,900 | $264,900 |
| 2018 | $5,734 | $372,800 | $137,700 | $235,100 |
| 2017 | $5,334 | $336,300 | $116,200 | $220,100 |
| 2016 | $5,185 | $330,900 | $110,800 | $220,100 |
| 2015 | -- | $307,500 | $101,800 | $205,700 |
Source: Public Records
Map
Nearby Homes
- 4 Willow Ave Unit 2
- 13 Roslyn St Unit 2
- 59 Leach St Unit 2
- 10 Hazel St Unit 2
- 6R Hazel Terrace Unit 1
- 29 Ocean Ave Unit 4
- 9 Glover St Unit 1
- 3 Chase St
- 1 Shore Ave
- 7 Fairfield St
- 185 Lafayette St Unit 3
- 326 Lafayette St Unit 2
- 24 Wisteria St Unit 2
- 88 Congress St Unit 3
- 22 Prescott St Unit 1
- 106 Broadway Unit 3
- 4 Fairview Rd
- 259 Jefferson Ave
- 263 Jefferson Ave
- 79 Lawrence St
- 14-16 Leach St
- 14 &16 Leach St
- 241 Lafayette St Unit 2
- 5 1/2 Leach St Unit 5 1/2
- 7 Leach St Unit 2L
- 7 Leach St Unit 3L
- 7 Leach St
- 5 Leach St Unit 3L
- 9 Leach St
- 11 Leach St
- 245 Lafayette St Unit 3H
- 245 Lafayette St Unit 3G
- 245 Lafayette St Unit 3F
- 245 Lafayette St Unit 3E
- 245 Lafayette St Unit 3D
- 245 Lafayette St Unit 3C
- 245 Lafayette St Unit 3B
- 245 Lafayette St Unit 3A
- 245 Lafayette St Unit 2H
- 245 Lafayette St Unit 2G
Your Personal Tour Guide
Ask me questions while you tour the home.