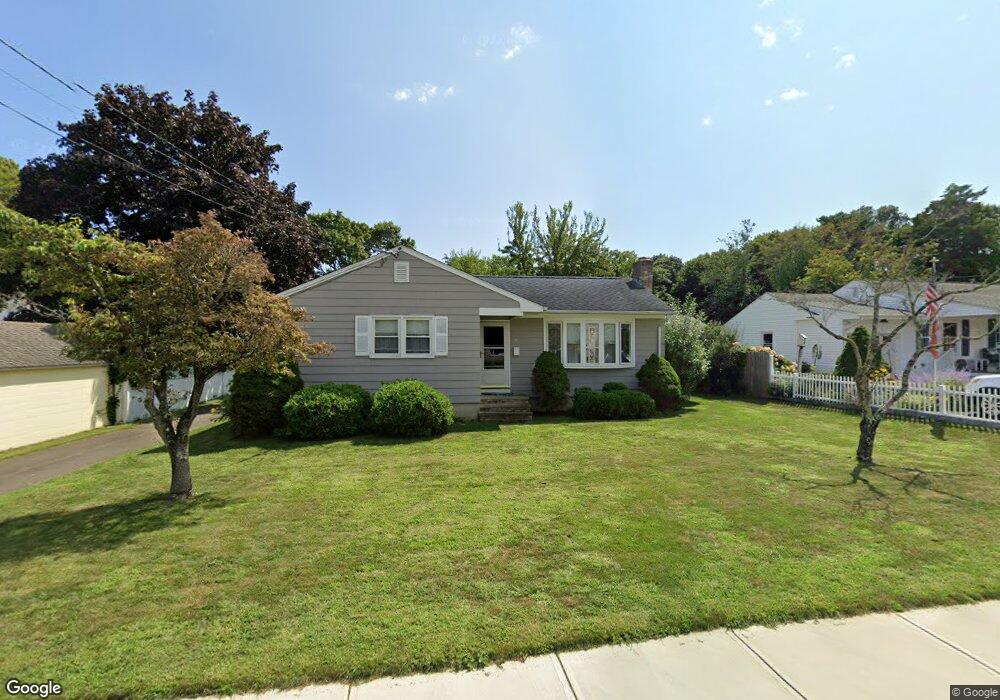
10 Leffingwell Rd Clinton, CT 06413
Estimated Value: $440,000 - $526,000
2
Beds
1
Bath
1,114
Sq Ft
$431/Sq Ft
Est. Value
About This Home
This home is located at 10 Leffingwell Rd, Clinton, CT 06413 and is currently estimated at $480,548, approximately $431 per square foot. 10 Leffingwell Rd is a home located in Middlesex County with nearby schools including Lewin G. Joel Jr. School, The Morgan School, and Our Lady of Mercy Preparatory Academy.
Ownership History
Date
Name
Owned For
Owner Type
Purchase Details
Closed on
Sep 14, 2015
Sold by
Harbor Moon Llc
Bought by
Waite Robin and Gardella Dan J
Current Estimated Value
Home Financials for this Owner
Home Financials are based on the most recent Mortgage that was taken out on this home.
Original Mortgage
$176,000
Outstanding Balance
$138,707
Interest Rate
4.01%
Estimated Equity
$341,841
Purchase Details
Closed on
Feb 17, 2005
Sold by
Chase Robert N
Bought by
Harbor Moon Llc
Purchase Details
Closed on
Jan 30, 2004
Sold by
Swan Carl F
Bought by
Chase Robert N
Home Financials for this Owner
Home Financials are based on the most recent Mortgage that was taken out on this home.
Original Mortgage
$200,000
Interest Rate
6%
Purchase Details
Closed on
Jun 28, 2002
Sold by
Hull Walter E
Bought by
Swan Carl F
Create a Home Valuation Report for This Property
The Home Valuation Report is an in-depth analysis detailing your home's value as well as a comparison with similar homes in the area
Home Values in the Area
Average Home Value in this Area
Purchase History
| Date | Buyer | Sale Price | Title Company |
|---|---|---|---|
| Waite Robin | $220,000 | -- | |
| Waite Robin V | $220,000 | -- | |
| Harbor Moon Llc | $285,000 | -- | |
| Harbor Moon Llc | $285,000 | -- | |
| Chase Robert N | $265,000 | -- | |
| Chase Robert N | $265,000 | -- | |
| Swan Carl F | $202,000 | -- | |
| Swan Carl F | $202,000 | -- |
Source: Public Records
Mortgage History
| Date | Status | Borrower | Loan Amount |
|---|---|---|---|
| Open | Waite Robin V | $176,000 | |
| Closed | Waite Robin V | $176,000 | |
| Previous Owner | Swan Carl F | $200,000 |
Source: Public Records
Tax History
| Year | Tax Paid | Tax Assessment Tax Assessment Total Assessment is a certain percentage of the fair market value that is determined by local assessors to be the total taxable value of land and additions on the property. | Land | Improvement |
|---|---|---|---|---|
| 2025 | $5,319 | $170,800 | $80,300 | $90,500 |
| 2024 | $5,168 | $170,800 | $80,300 | $90,500 |
| 2023 | $5,095 | $170,800 | $80,300 | $90,500 |
| 2022 | $5,095 | $170,800 | $80,300 | $90,500 |
| 2021 | $5,444 | $182,500 | $95,300 | $87,200 |
| 2020 | $5,703 | $182,500 | $95,300 | $87,200 |
| 2019 | $5,703 | $182,500 | $95,300 | $87,200 |
| 2018 | $5,574 | $182,500 | $95,300 | $87,200 |
| 2017 | $5,459 | $182,500 | $95,300 | $87,200 |
| 2016 | $4,953 | $182,500 | $95,300 | $87,200 |
| 2015 | $4,211 | $157,300 | $71,000 | $86,300 |
| 2014 | $4,132 | $157,300 | $71,000 | $86,300 |
Source: Public Records
Map
Nearby Homes
- 116 Commerce St Unit F-9
- 0 Cow Hill Rd
- 64 W Main St
- 13 Waterside Ln
- 110 E Main St
- 16 Silverbrook Ln
- 144 E Main St Unit 5
- 133 W Main St Unit MV1
- 133 W Main St Unit TRLR A9
- 151 E Main St Unit 12
- 153 E Main St Unit 10
- 153 E Main St Unit 13
- 153 E Main St Unit 31
- 153 E Main St Unit 8
- 153 E Main St Unit 9
- 153 E Main St Unit 6
- 153 E Main St Unit 7
- 153 E Main St Unit 11
- 153 E Main St Unit 32
- 153 E Main St Unit 5
- 12 Leffingwell Rd
- 59 Commerce St
- 61 Commerce St
- 63 Commerce St
- 11 aka 13 Leffingwell Rd
- 65 Commerce St
- 14 Leffingwell Rd
- 13 Leffingwell Rd
- 7 Leffingwell Rd
- 67 Commerce St
- 18 Leffingwell Rd
- 15 Leffingwell Rd
- 71 Commerce St
- 58 Commerce St Unit B
- 58 Commerce St
- 73 Commerce St
- 22 Leffingwell Rd
- 0 Commerce St
- 1 Indian Dr
- 17 Leffingwell Rd
Your Personal Tour Guide
Ask me questions while you tour the home.