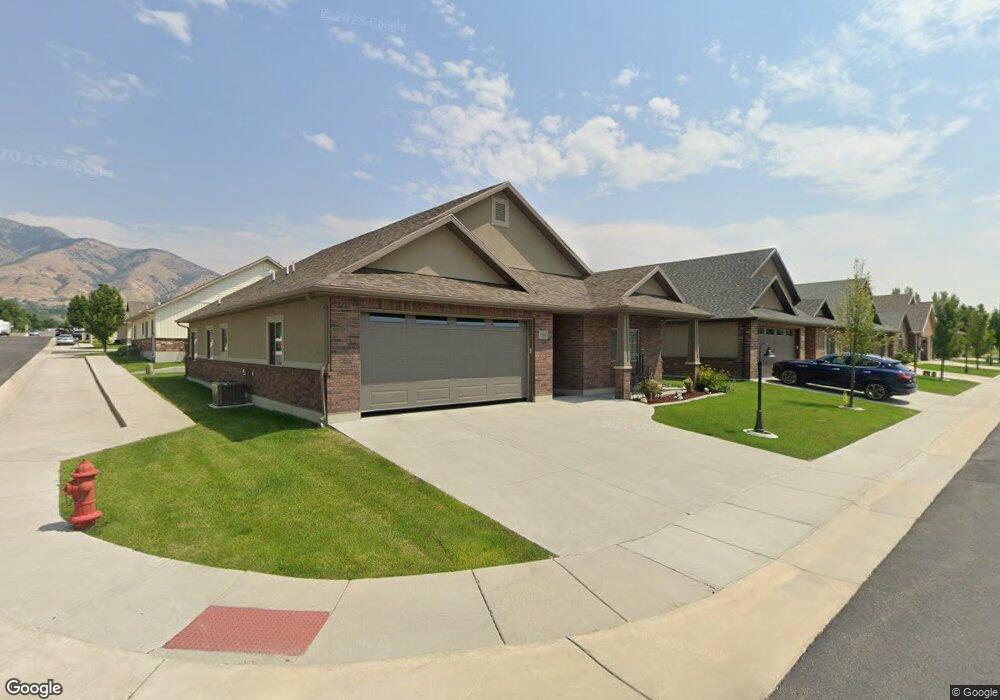
10 Leisure Loop Hyde Park, UT 84318
Estimated Value: $469,000 - $521,000
2
Beds
2
Baths
1,936
Sq Ft
$261/Sq Ft
Est. Value
About This Home
This home is located at 10 Leisure Loop, Hyde Park, UT 84318 and is currently estimated at $504,331, approximately $260 per square foot. 10 Leisure Loop is a home located in Cache County with nearby schools including North Park School, Cedar Ridge School, and North Cache Middle School.
Ownership History
Date
Name
Owned For
Owner Type
Purchase Details
Closed on
Mar 23, 2023
Sold by
Welch Terry
Bought by
Terry Welch And Hope S Welch Family Trust
Current Estimated Value
Purchase Details
Closed on
Nov 1, 2022
Sold by
Mervin And Joe Ann Thompson Family Trust
Bought by
Welch Terry and Welch Hope
Home Financials for this Owner
Home Financials are based on the most recent Mortgage that was taken out on this home.
Original Mortgage
$383,200
Interest Rate
7.08%
Mortgage Type
New Conventional
Purchase Details
Closed on
Apr 5, 2019
Sold by
Ashworth Gene and Ashworth Karlene
Bought by
Rlt Eugene C and Rlt Karlene
Purchase Details
Closed on
May 10, 2016
Sold by
Northern Meadows-Development Inc
Bought by
Ashworth Gene and Ashworth Karlene
Create a Home Valuation Report for This Property
The Home Valuation Report is an in-depth analysis detailing your home's value as well as a comparison with similar homes in the area
Home Values in the Area
Average Home Value in this Area
Purchase History
| Date | Buyer | Sale Price | Title Company |
|---|---|---|---|
| Terry Welch And Hope S Welch Family Trust | -- | Us Title | |
| Welch Terry | -- | -- | |
| Rlt Eugene C | -- | None Available | |
| Ashworth Gene | -- | Cache Title Logan |
Source: Public Records
Mortgage History
| Date | Status | Borrower | Loan Amount |
|---|---|---|---|
| Previous Owner | Welch Terry | $383,200 |
Source: Public Records
Tax History
| Year | Tax Paid | Tax Assessment Tax Assessment Total Assessment is a certain percentage of the fair market value that is determined by local assessors to be the total taxable value of land and additions on the property. | Land | Improvement |
|---|---|---|---|---|
| 2025 | $1,985 | $273,630 | $0 | $0 |
| 2024 | $1,915 | $243,495 | $0 | $0 |
| 2023 | $1,988 | $240,405 | $0 | $0 |
| 2022 | $2,067 | $240,405 | $0 | $0 |
| 2021 | $1,955 | $357,114 | $70,000 | $287,114 |
| 2020 | $1,840 | $319,665 | $70,000 | $249,665 |
| 2019 | $1,939 | $319,664 | $70,000 | $249,664 |
| 2018 | $1,719 | $277,915 | $55,000 | $222,915 |
| 2017 | $1,728 | $147,015 | $0 | $0 |
| 2016 | $1,753 | $55,000 | $0 | $0 |
| 2015 | $649 | $55,000 | $0 | $0 |
| 2014 | $448 | $39,000 | $0 | $0 |
Source: Public Records
Map
Nearby Homes
- 27 Leisure Loop
- 200 E Memory Ln Unit LNP2
- 200 E Memory Ln
- 29 Leisure Loop
- 200 E Memory Ln Unit 6
- 19 Leisure Loop
- 4 E Memory Ln
- 3 E Memory Ln
- 28 Leisure Loop
- 12 Leisure Loop
- 26 Leisure Loop
- 25 Leisure Loop
- 24 Leisure Loop
- 14 Leisure Loop
- 11 Leisure Loop
- 13 Leisure Loop
- 23 Leisure Loop
- 16 Leisure Loop
- 22 Leisure Loop
- 15 Leisure Loop
Your Personal Tour Guide
Ask me questions while you tour the home.