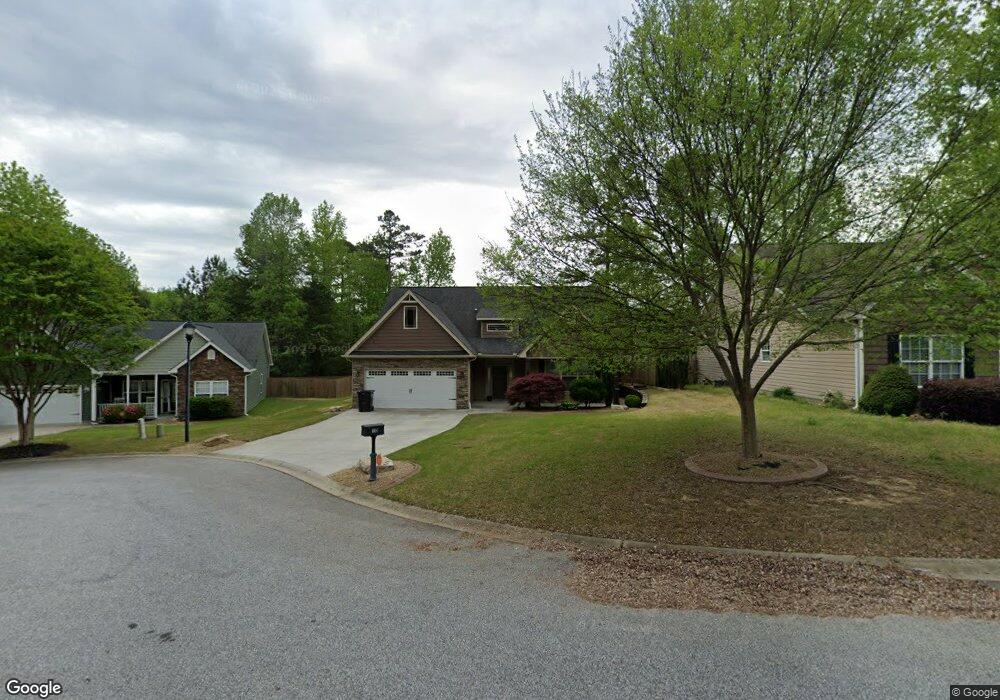
10 Leland Cypress Ct Simpsonville, SC 29681
Estimated Value: $353,391 - $418,000
3
Beds
2
Baths
2,020
Sq Ft
$189/Sq Ft
Est. Value
About This Home
This home is located at 10 Leland Cypress Ct, Simpsonville, SC 29681 and is currently estimated at $382,098, approximately $189 per square foot. 10 Leland Cypress Ct is a home located in Greenville County with nearby schools including Simpsonville Elementary, Hillcrest Middle School, and Hillcrest High School.
Ownership History
Date
Name
Owned For
Owner Type
Purchase Details
Closed on
May 20, 2016
Sold by
Beale Darla S and Beale David Kenneth
Bought by
Robinson Quentin C
Current Estimated Value
Home Financials for this Owner
Home Financials are based on the most recent Mortgage that was taken out on this home.
Original Mortgage
$209,632
Outstanding Balance
$165,287
Interest Rate
3.37%
Mortgage Type
FHA
Estimated Equity
$216,811
Purchase Details
Closed on
Jan 20, 2012
Sold by
Niemela Curt E
Bought by
Beale David Kenneth and Beale Darla S
Home Financials for this Owner
Home Financials are based on the most recent Mortgage that was taken out on this home.
Original Mortgage
$159,842
Interest Rate
3.87%
Mortgage Type
FHA
Purchase Details
Closed on
May 19, 2010
Sold by
Aho Homes Llc
Bought by
Niemela Curt E
Purchase Details
Closed on
Sep 21, 2006
Sold by
New Generations R E Llc
Bought by
Aho Homes Llc
Create a Home Valuation Report for This Property
The Home Valuation Report is an in-depth analysis detailing your home's value as well as a comparison with similar homes in the area
Home Values in the Area
Average Home Value in this Area
Purchase History
| Date | Buyer | Sale Price | Title Company |
|---|---|---|---|
| Robinson Quentin C | $213,500 | None Available | |
| Beale David Kenneth | $164,000 | -- | |
| Niemela Curt E | $260,000 | -- | |
| Aho Homes Llc | $645,000 | None Available |
Source: Public Records
Mortgage History
| Date | Status | Borrower | Loan Amount |
|---|---|---|---|
| Open | Robinson Quentin C | $209,632 | |
| Previous Owner | Beale David Kenneth | $159,842 |
Source: Public Records
Tax History Compared to Growth
Tax History
| Year | Tax Paid | Tax Assessment Tax Assessment Total Assessment is a certain percentage of the fair market value that is determined by local assessors to be the total taxable value of land and additions on the property. | Land | Improvement |
|---|---|---|---|---|
| 2024 | $1,847 | $9,240 | $1,400 | $7,840 |
| 2023 | $1,847 | $9,240 | $1,400 | $7,840 |
| 2022 | $1,804 | $9,240 | $1,400 | $7,840 |
| 2021 | $1,805 | $9,240 | $1,400 | $7,840 |
| 2020 | $1,691 | $8,090 | $1,040 | $7,050 |
| 2019 | $1,692 | $8,090 | $1,040 | $7,050 |
| 2018 | $1,556 | $8,090 | $1,040 | $7,050 |
| 2017 | $1,556 | $8,090 | $1,040 | $7,050 |
| 2016 | $1,271 | $170,880 | $26,000 | $144,880 |
| 2015 | $1,271 | $170,880 | $26,000 | $144,880 |
| 2014 | $1,132 | $154,260 | $32,000 | $122,260 |
Source: Public Records
Map
Nearby Homes
- 502 Kingsmoor Dr
- 301 Blant Ct
- 27 Farmbrook Way
- 6 Paranor Dr
- 104 Shea Ct
- 213 Harts Ln
- 108 Acacia Dr
- 240 Applehill Way
- 1 Lone Oak Ave
- 15 Knights Valley Dr
- 112 Cameron Creek Ln
- 2 Pembark Ln
- 907 Highway 14
- 27 Laurelhart Ln
- 146 Stokes Rd
- 220 Plain Post Trail
- 102 Plain Post Trail
- 106 Plain Post Trail
- 202 Plain Post Trail
- 6 Worthington Ct
- 6 Leland Cypress Ct
- 5 Bellerive Place
- 14 Leland Cypress Ct
- 105 Lost Tree Ln
- 9 Bellerive Place
- 15 Leland Cypress Ct
- 9 Leland Cypress Ct
- 101 Lost Tree Ln
- 5 Leland Cypress Ct
- 1 Bellerive Place
- 10 Bellerive Place
- 1 Leland Cypress Ct
- 104 Lost Tree Ln
- 6 Bellerive Place
- 108 Lost Tree Ln
- 100 Lost Tree Ln
- 112 Lost Tree Ln
- 201 Lost Tree Ln
- 116 Lost Tree Ln
- 6 Lost Tree Ln