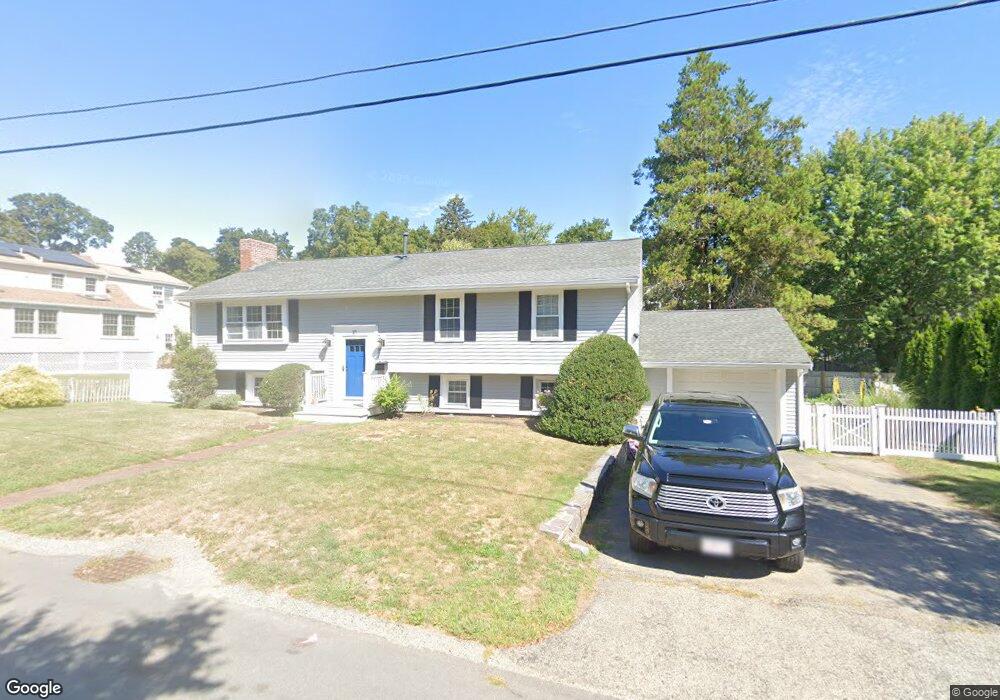
10 Leonard St Unit 10 Hingham, MA 02043
Estimated Value: $1,263,000 - $1,326,497
4
Beds
3
Baths
2,448
Sq Ft
$527/Sq Ft
Est. Value
About This Home
This home is located at 10 Leonard St Unit 10, Hingham, MA 02043 and is currently estimated at $1,290,624, approximately $527 per square foot. 10 Leonard St Unit 10 is a home located in Plymouth County with nearby schools including East Elementary School, Hingham Middle School, and Hingham High School.
Ownership History
Date
Name
Owned For
Owner Type
Purchase Details
Closed on
Jun 1, 2021
Sold by
4 Ivy Court Rt and Scanlon
Bought by
Manning Michael
Current Estimated Value
Home Financials for this Owner
Home Financials are based on the most recent Mortgage that was taken out on this home.
Original Mortgage
$867,477
Outstanding Balance
$783,227
Interest Rate
3%
Mortgage Type
Purchase Money Mortgage
Estimated Equity
$507,397
Purchase Details
Closed on
Jun 3, 2010
Sold by
Abbott Robert P and Abbott Barbara S
Bought by
Scanlon Tr George F and Scanlon Jane M
Create a Home Valuation Report for This Property
The Home Valuation Report is an in-depth analysis detailing your home's value as well as a comparison with similar homes in the area
Purchase History
| Date | Buyer | Sale Price | Title Company |
|---|---|---|---|
| Manning Michael | $955,000 | None Available | |
| Scanlon Tr George F | $519,000 | -- | |
| Scanlon Tr George F | $519,000 | -- |
Source: Public Records
Mortgage History
| Date | Status | Borrower | Loan Amount |
|---|---|---|---|
| Open | Manning Michael | $867,477 | |
| Previous Owner | Scanlon Tr George F | $186,000 | |
| Previous Owner | Scanlon Tr George F | $170,000 |
Source: Public Records
Tax History
| Year | Tax Paid | Tax Assessment Tax Assessment Total Assessment is a certain percentage of the fair market value that is determined by local assessors to be the total taxable value of land and additions on the property. | Land | Improvement |
|---|---|---|---|---|
| 2025 | $10,810 | $1,011,200 | $444,100 | $567,100 |
| 2024 | $10,356 | $954,500 | $444,100 | $510,400 |
| 2023 | $9,156 | $915,600 | $444,100 | $471,500 |
| 2022 | $6,928 | $599,300 | $370,100 | $229,200 |
| 2021 | $6,806 | $576,800 | $370,100 | $206,700 |
| 2020 | $6,611 | $573,400 | $370,100 | $203,300 |
| 2019 | $5,998 | $507,900 | $325,700 | $182,200 |
| 2018 | $5,936 | $504,300 | $325,700 | $178,600 |
| 2017 | $5,900 | $481,600 | $299,000 | $182,600 |
| 2016 | $6,048 | $484,200 | $284,800 | $199,400 |
| 2015 | $5,897 | $470,600 | $271,200 | $199,400 |
Source: Public Records
Map
Nearby Homes
Your Personal Tour Guide
Ask me questions while you tour the home.