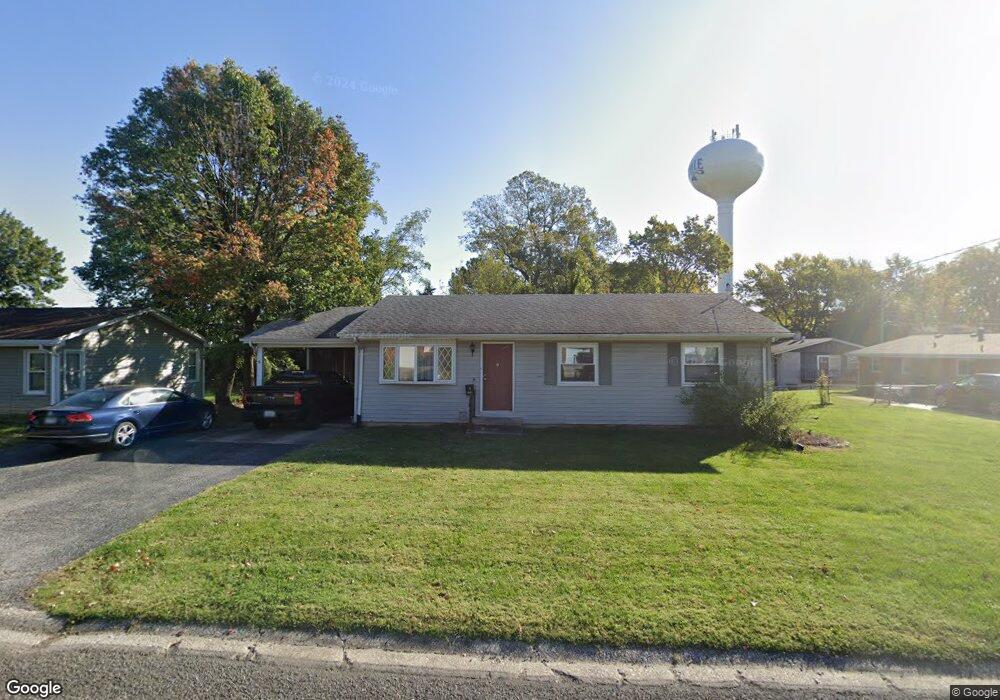
10 Lexington Ct Collinsville, IL 62234
Estimated Value: $193,000 - $220,000
3
Beds
2
Baths
1,260
Sq Ft
$163/Sq Ft
Est. Value
About This Home
This home is located at 10 Lexington Ct, Collinsville, IL 62234 and is currently estimated at $205,278, approximately $162 per square foot. 10 Lexington Ct is a home located in Madison County with nearby schools including John A Renfro Elementary School, Dorris Intermediate School, and Collinsville Middle School.
Ownership History
Date
Name
Owned For
Owner Type
Purchase Details
Closed on
Jun 18, 2010
Sold by
The Secretary Of Housing & Urban Develop
Bought by
Martin Jeremey and Wilde Andrew
Current Estimated Value
Home Financials for this Owner
Home Financials are based on the most recent Mortgage that was taken out on this home.
Original Mortgage
$86,912
Outstanding Balance
$59,043
Interest Rate
5.25%
Mortgage Type
FHA
Estimated Equity
$146,235
Purchase Details
Closed on
Jan 29, 2010
Sold by
Peoples Jennifer
Bought by
The Secretary Of Housing & Urban Develop
Purchase Details
Closed on
Nov 28, 2003
Sold by
Brown David Lee and Brown Carol
Bought by
Peoples James and Peoples Jennifer
Home Financials for this Owner
Home Financials are based on the most recent Mortgage that was taken out on this home.
Original Mortgage
$111,999
Interest Rate
6.01%
Mortgage Type
FHA
Create a Home Valuation Report for This Property
The Home Valuation Report is an in-depth analysis detailing your home's value as well as a comparison with similar homes in the area
Home Values in the Area
Average Home Value in this Area
Purchase History
| Date | Buyer | Sale Price | Title Company |
|---|---|---|---|
| Martin Jeremey | -- | Lakeside Title & Escrow Agen | |
| The Secretary Of Housing & Urban Develop | -- | None Available | |
| Peoples James | $113,000 | -- |
Source: Public Records
Mortgage History
| Date | Status | Borrower | Loan Amount |
|---|---|---|---|
| Open | Martin Jeremey | $86,912 | |
| Previous Owner | Peoples James | $111,999 |
Source: Public Records
Tax History Compared to Growth
Tax History
| Year | Tax Paid | Tax Assessment Tax Assessment Total Assessment is a certain percentage of the fair market value that is determined by local assessors to be the total taxable value of land and additions on the property. | Land | Improvement |
|---|---|---|---|---|
| 2024 | $3,523 | $61,100 | $14,650 | $46,450 |
| 2023 | $3,523 | $55,790 | $13,330 | $42,460 |
| 2022 | $3,277 | $51,590 | $12,330 | $39,260 |
| 2021 | $2,933 | $48,460 | $11,580 | $36,880 |
| 2020 | $2,809 | $46,240 | $11,050 | $35,190 |
| 2019 | $2,462 | $41,000 | $10,310 | $30,690 |
| 2018 | $2,394 | $38,840 | $9,770 | $29,070 |
| 2017 | $2,388 | $38,070 | $9,580 | $28,490 |
| 2016 | $2,506 | $38,070 | $9,580 | $28,490 |
| 2015 | $2,269 | $37,080 | $9,330 | $27,750 |
| 2014 | $2,269 | $37,080 | $9,330 | $27,750 |
| 2013 | $2,269 | $37,080 | $9,330 | $27,750 |
Source: Public Records
Map
Nearby Homes
- 414 Bunker Hill Dr
- 0 N Keebler Ave
- 1224 Cedar Ridge Ct
- 10 White Lily Dr
- 22 Brookwood Dr
- 203 Greenfield Dr
- 5 Brookwood Dr
- 1120 Williams St
- 308 Brown Ave
- 1210 Constance St
- 617 N Morrison Ave
- 2007 Belt Line Rd
- 123 Elliot St
- 0 Strong Ave
- 1121 Carraway Ct
- 123 W Wickliffe Ave
- 102 Toni Ct
- 706 Illinois Ave
- 625 W Country Ln
- 501 Spring
- 9 Lexington Ct
- 103 Lexington Dr
- 105 Lexington Dr
- 8 Lexington Ct
- 6 Lexington Ct
- 1 Lexington Ct
- 7 Lexington Ct
- 3 Lexington Ct
- 5 Lexington Ct
- 104 Lexington Dr
- 2 Lexington Ct
- 102 Lexington Dr
- 107 Lexington Dr
- 100 Lexington Dr
- 109 Lexington Dr
- 110 Bridle Ridge Rd
- 4 Crestmont Dr
- 112 Bridle Ridge Rd
- 108 Bridle Ridge Rd
- 106 Bridle Ridge Rd