Estimated Value: $529,000 - $646,000
Studio
--
Bath
2,248
Sq Ft
$253/Sq Ft
Est. Value
About This Home
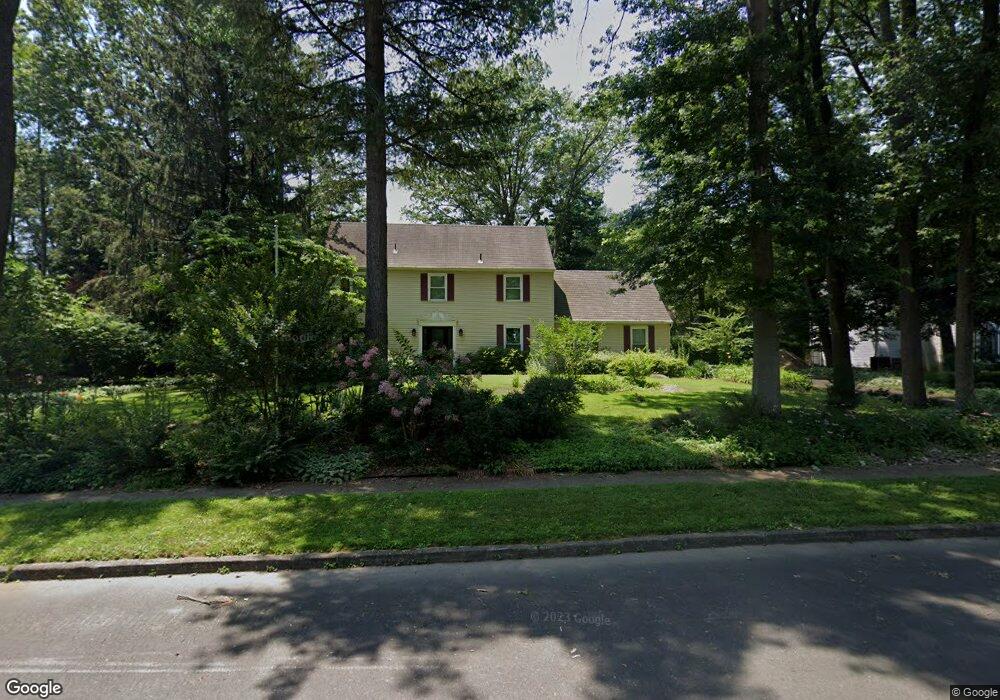
This home is located at 10 Locke Ct, Ewing, NJ 08628 and is currently estimated at $568,644, approximately $252 per square foot. 10 Locke Ct is a home located in Mercer County with nearby schools including Ewing High School, The Village Charter School, and Christina Seix Academy.
Ownership History
Date
Name
Owned For
Owner Type
Purchase Details
Closed on
Sep 27, 2007
Sold by
Ziegler Edward F and Ziegler Kimberly A
Bought by
Phillips Joel and Scheiber Elizabeth
Current Estimated Value
Home Financials for this Owner
Home Financials are based on the most recent Mortgage that was taken out on this home.
Original Mortgage
$225,000
Outstanding Balance
$143,686
Interest Rate
6.65%
Mortgage Type
New Conventional
Estimated Equity
$424,958
Purchase Details
Closed on
Nov 22, 1999
Sold by
Bilik John
Bought by
Ziegler Edward and Ziegler Kimberly
Home Financials for this Owner
Home Financials are based on the most recent Mortgage that was taken out on this home.
Original Mortgage
$218,000
Interest Rate
7.77%
Create a Home Valuation Report for This Property
The Home Valuation Report is an in-depth analysis detailing your home's value as well as a comparison with similar homes in the area
Home Values in the Area
Average Home Value in this Area
Purchase History
| Date | Buyer | Sale Price | Title Company |
|---|---|---|---|
| Phillips Joel | $452,000 | -- | |
| Ziegler Edward | $218,000 | -- |
Source: Public Records
Mortgage History
| Date | Status | Borrower | Loan Amount |
|---|---|---|---|
| Open | Phillips Joel | $225,000 | |
| Previous Owner | Ziegler Edward | $218,000 |
Source: Public Records
Tax History
| Year | Tax Paid | Tax Assessment Tax Assessment Total Assessment is a certain percentage of the fair market value that is determined by local assessors to be the total taxable value of land and additions on the property. | Land | Improvement |
|---|---|---|---|---|
| 2025 | $13,392 | $340,500 | $103,800 | $236,700 |
| 2024 | $12,588 | $340,500 | $103,800 | $236,700 |
| 2023 | $12,588 | $340,500 | $103,800 | $236,700 |
| 2022 | $12,248 | $340,500 | $103,800 | $236,700 |
| 2021 | $11,948 | $340,500 | $103,800 | $236,700 |
| 2020 | $11,778 | $340,500 | $103,800 | $236,700 |
| 2019 | $11,471 | $340,500 | $103,800 | $236,700 |
| 2018 | $11,071 | $209,600 | $56,300 | $153,300 |
| 2017 | $11,329 | $209,600 | $56,300 | $153,300 |
| 2016 | $11,176 | $209,600 | $56,300 | $153,300 |
| 2015 | $11,027 | $209,600 | $56,300 | $153,300 |
| 2014 | $10,998 | $209,600 | $56,300 | $153,300 |
Source: Public Records
Map
Nearby Homes
- 4 Riverview Dr
- 3 Mansion Hill Dr
- 24 Jacob Ct
- 30 Matthew Dr
- 16 Jacob Ct
- 12 Jacob Ct
- 77 Morgan Ave
- 6 Rebecca Ct
- 8 Rebecca Ct
- 182 W Upper Ferry Rd
- 1048 River Rd
- 42 W College Ave Unit 222
- 8 Beckett Ct
- 163 S Main St
- 7 Balamor Ln
- 5 Tudor Ct
- 15 Leicester Ln
- 1105 Yardley Commons
- 201 Yardley Commons
- 16 Wilbur Rd
Your Personal Tour Guide
Ask me questions while you tour the home.