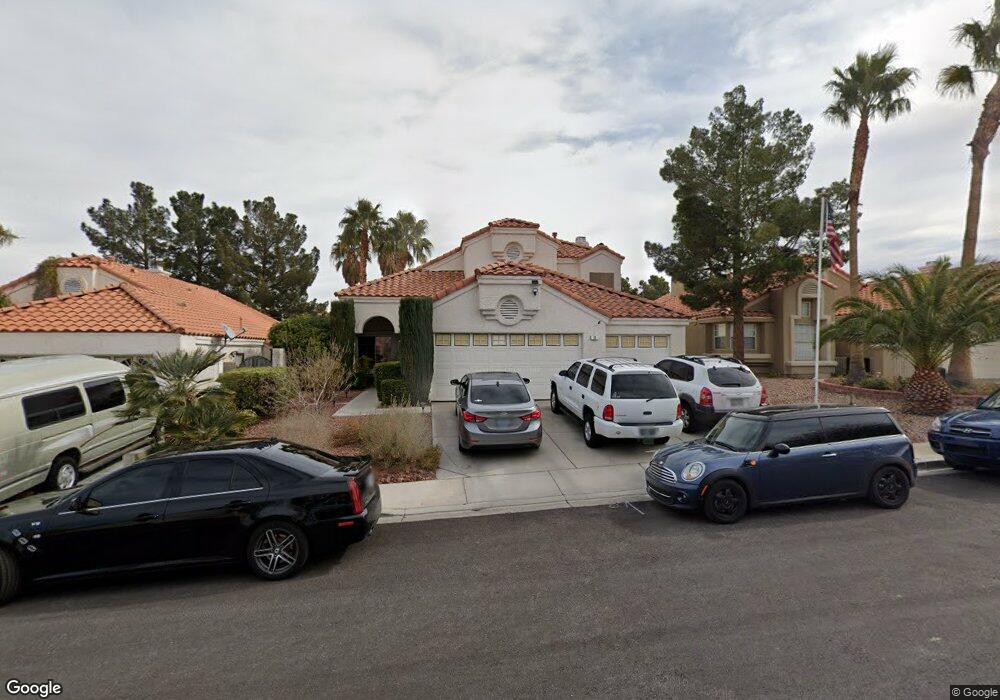
10 Lockhaven Ct Henderson, NV 89074
Green Valley South NeighborhoodEstimated Value: $561,000 - $614,000
4
Beds
3
Baths
2,141
Sq Ft
$273/Sq Ft
Est. Value
About This Home
This home is located at 10 Lockhaven Ct, Henderson, NV 89074 and is currently estimated at $584,365, approximately $272 per square foot. 10 Lockhaven Ct is a home located in Clark County with nearby schools including Selma F Bartlett Elementary School, Barbara and Hank Greenspun Junior High School, and Coronado High School.
Ownership History
Date
Name
Owned For
Owner Type
Purchase Details
Closed on
Jan 30, 2012
Sold by
Winkler Tamara
Bought by
Winkler Ronald
Current Estimated Value
Home Financials for this Owner
Home Financials are based on the most recent Mortgage that was taken out on this home.
Original Mortgage
$177,230
Outstanding Balance
$121,188
Interest Rate
3.85%
Mortgage Type
VA
Estimated Equity
$463,177
Purchase Details
Closed on
Jan 26, 2012
Sold by
Winkler Ronald
Bought by
True Kevin
Home Financials for this Owner
Home Financials are based on the most recent Mortgage that was taken out on this home.
Original Mortgage
$177,230
Outstanding Balance
$121,188
Interest Rate
3.85%
Mortgage Type
VA
Estimated Equity
$463,177
Purchase Details
Closed on
Jul 27, 2004
Sold by
Mccluney James Allen and Mccluney Alicia Marie
Bought by
Winkler Ronald
Home Financials for this Owner
Home Financials are based on the most recent Mortgage that was taken out on this home.
Original Mortgage
$244,250
Interest Rate
5.62%
Mortgage Type
New Conventional
Create a Home Valuation Report for This Property
The Home Valuation Report is an in-depth analysis detailing your home's value as well as a comparison with similar homes in the area
Home Values in the Area
Average Home Value in this Area
Purchase History
| Date | Buyer | Sale Price | Title Company |
|---|---|---|---|
| Winkler Ronald | -- | Equity Title Of Nevada | |
| True Kevin | $173,500 | Equity Title Of Nevada | |
| Winkler Ronald | $415,000 | First American Title Co Of |
Source: Public Records
Mortgage History
| Date | Status | Borrower | Loan Amount |
|---|---|---|---|
| Open | True Kevin | $177,230 | |
| Previous Owner | Winkler Ronald | $244,250 | |
| Closed | Winkler Ronald | $150,000 |
Source: Public Records
Tax History Compared to Growth
Tax History
| Year | Tax Paid | Tax Assessment Tax Assessment Total Assessment is a certain percentage of the fair market value that is determined by local assessors to be the total taxable value of land and additions on the property. | Land | Improvement |
|---|---|---|---|---|
| 2025 | $3,180 | $125,710 | $48,300 | $77,410 |
| 2024 | $2,945 | $125,710 | $48,300 | $77,410 |
| 2023 | $2,945 | $115,136 | $41,125 | $74,011 |
| 2022 | $2,727 | $103,164 | $35,000 | $68,164 |
| 2021 | $2,525 | $94,926 | $29,750 | $65,176 |
| 2020 | $2,342 | $94,588 | $29,750 | $64,838 |
| 2019 | $2,195 | $91,499 | $27,300 | $64,199 |
| 2018 | $2,094 | $85,652 | $23,450 | $62,202 |
| 2017 | $2,411 | $83,164 | $19,600 | $63,564 |
| 2016 | $1,961 | $80,879 | $17,150 | $63,729 |
| 2015 | $1,957 | $69,087 | $15,400 | $53,687 |
| 2014 | $1,896 | $65,174 | $10,850 | $54,324 |
Source: Public Records
Map
Nearby Homes
- 7 Barton Spring Cir
- 30 Daisy Meadow Terrace Unit 1
- 87 Ginger Lily Terrace
- 251 Chestnut Ridge Cir
- 114 Weatherwood Ct
- 2008 Spruce Brook Dr
- 95 Callaway Cir Unit 3
- 1966 Windfall Ave
- 2107 Eaglepath Cir
- 95 Arthur Hills Ct
- 2090 Eaglepath Cir
- 2005 Summerside Ct
- 2084 Eaglepath Cir
- 1910 Grey Eagle St
- 2260 Village Walk Dr Unit 1305
- 20 Staghorn St
- 79 Magical Mystery Ln
- 2201 Ramsgate Dr Unit 1127
- 2201 Ramsgate Dr Unit 923
- 2201 Ramsgate Dr Unit 816
- 12 Lockhaven Ct
- 8 Lockhaven Ct
- 6 Lockhaven Ct
- 14 Lockhaven Ct
- 11 Barton Spring Cir
- 9 Barton Spring Cir
- 13 Barton Spring Cir
- 9 Lockhaven Ct
- 4 Lockhaven Ct
- 11 Lockhaven Ct
- 15 Barton Spring Cir
- 15 Barton Spring Cir
- 15 Barton Spring Cir
- 15 Barton Spring Cir
- 15 Barton Spring Cir
- 15 Barton Spring Cir
- 7 Lockhaven Ct
- 5 Barton Spring Cir
- 13 Lockhaven Ct
- 5 Lockhaven Ct