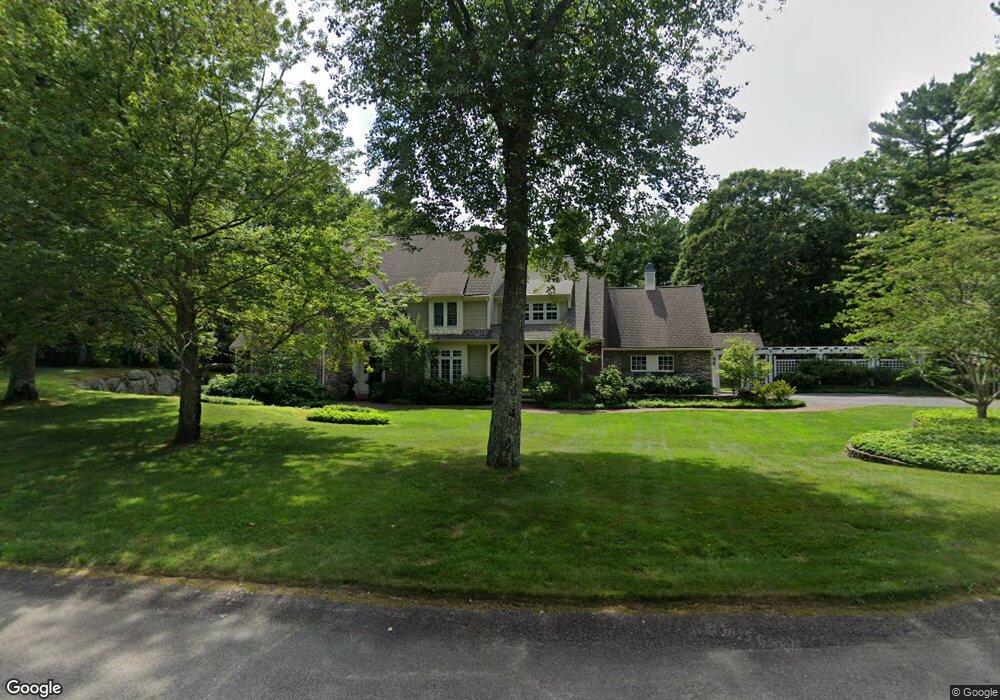
10 Lorimar Ln Rehoboth, MA 02769
Estimated Value: $1,095,000 - $1,229,000
4
Beds
3
Baths
3,713
Sq Ft
$312/Sq Ft
Est. Value
About This Home
This home is located at 10 Lorimar Ln, Rehoboth, MA 02769 and is currently estimated at $1,159,735, approximately $312 per square foot. 10 Lorimar Ln is a home located in Bristol County with nearby schools including Dighton-Rehoboth Regional High School and Cedar Brook School.
Ownership History
Date
Name
Owned For
Owner Type
Purchase Details
Closed on
Apr 7, 1998
Sold by
Monarch Builders Inc
Bought by
Falcon Stephen J and Falco Dana L
Current Estimated Value
Create a Home Valuation Report for This Property
The Home Valuation Report is an in-depth analysis detailing your home's value as well as a comparison with similar homes in the area
Home Values in the Area
Average Home Value in this Area
Purchase History
| Date | Buyer | Sale Price | Title Company |
|---|---|---|---|
| Falcon Stephen J | $130,000 | -- |
Source: Public Records
Mortgage History
| Date | Status | Borrower | Loan Amount |
|---|---|---|---|
| Open | Falcon Stephen J | $360,100 | |
| Closed | Falcon Stephen J | $510,000 | |
| Closed | Falcon Stephen J | $181,600 |
Source: Public Records
Tax History Compared to Growth
Tax History
| Year | Tax Paid | Tax Assessment Tax Assessment Total Assessment is a certain percentage of the fair market value that is determined by local assessors to be the total taxable value of land and additions on the property. | Land | Improvement |
|---|---|---|---|---|
| 2025 | $126 | $1,129,200 | $203,300 | $925,900 |
| 2024 | $11,259 | $991,100 | $212,000 | $779,100 |
| 2023 | $10,463 | $960,400 | $207,600 | $752,800 |
| 2022 | $10,463 | $825,800 | $190,700 | $635,100 |
| 2021 | $10,948 | $826,900 | $174,100 | $652,800 |
| 2020 | $10,533 | $802,800 | $177,300 | $625,500 |
| 2018 | $8,890 | $742,700 | $173,600 | $569,100 |
| 2017 | $8,197 | $652,600 | $181,200 | $471,400 |
| 2016 | $8,023 | $660,300 | $188,900 | $471,400 |
| 2015 | $7,814 | $634,800 | $180,300 | $454,500 |
| 2014 | $7,789 | $626,100 | $171,600 | $454,500 |
Source: Public Records
Map
Nearby Homes
- 111 Summer St
- 20 School St
- 23 Colonial Way
- 0 Winter St
- 63 Moulton St
- 37 Colonial Way
- 248 County
- 15 Hickory Ridge Rd
- 8 Linden Ln
- 8 Linden Ln
- 67 Wheeler St
- 31 Woodland Way
- 23 Bay State Rd
- 0 Winthrop St Unit 73180872
- 246 Winthrop St
- 198 Brook St
- 206 Moulton St
- 225 Winthrop St
- 42 Linden Ln
- 15 Carpenter St