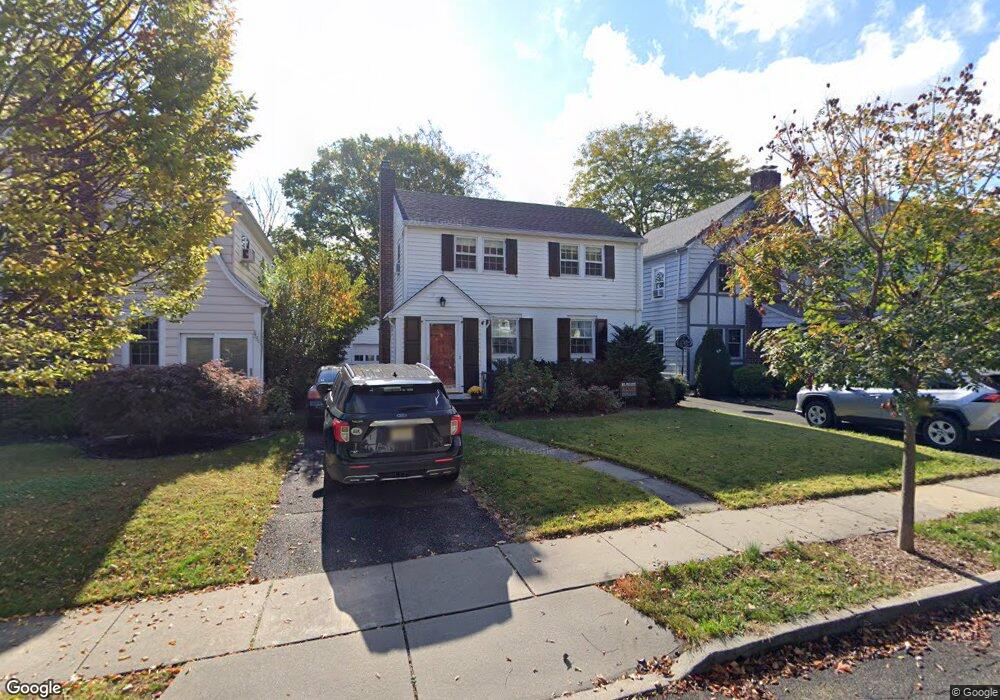
10 Lorraine St Glen Ridge, NJ 07028
Estimated Value: $812,798 - $1,050,000
--
Bed
--
Bath
1,336
Sq Ft
$696/Sq Ft
Est. Value
About This Home
This home is located at 10 Lorraine St, Glen Ridge, NJ 07028 and is currently estimated at $929,700, approximately $695 per square foot. 10 Lorraine St is a home located in Essex County with nearby schools including Linden Avenue Elementary School, Ridgewood Avenue School, and Glen Ridge High School.
Ownership History
Date
Name
Owned For
Owner Type
Purchase Details
Closed on
Apr 27, 2001
Sold by
Haring Marjorie A
Bought by
Sullivan Matthew C and Sullivan Tracy A
Current Estimated Value
Home Financials for this Owner
Home Financials are based on the most recent Mortgage that was taken out on this home.
Original Mortgage
$202,000
Outstanding Balance
$75,426
Interest Rate
7.03%
Estimated Equity
$854,274
Create a Home Valuation Report for This Property
The Home Valuation Report is an in-depth analysis detailing your home's value as well as a comparison with similar homes in the area
Home Values in the Area
Average Home Value in this Area
Purchase History
| Date | Buyer | Sale Price | Title Company |
|---|---|---|---|
| Sullivan Matthew C | $240,000 | -- |
Source: Public Records
Mortgage History
| Date | Status | Borrower | Loan Amount |
|---|---|---|---|
| Open | Sullivan Matthew C | $202,000 |
Source: Public Records
Tax History Compared to Growth
Tax History
| Year | Tax Paid | Tax Assessment Tax Assessment Total Assessment is a certain percentage of the fair market value that is determined by local assessors to be the total taxable value of land and additions on the property. | Land | Improvement |
|---|---|---|---|---|
| 2025 | $15,942 | $472,500 | $320,000 | $152,500 |
| 2024 | $15,942 | $472,500 | $320,000 | $152,500 |
| 2022 | $15,559 | $472,500 | $320,000 | $152,500 |
| 2021 | $15,333 | $472,500 | $320,000 | $152,500 |
| 2020 | $15,059 | $472,500 | $320,000 | $152,500 |
| 2019 | $14,605 | $472,500 | $320,000 | $152,500 |
| 2018 | $13,487 | $365,600 | $239,300 | $126,300 |
| 2017 | $13,187 | $365,600 | $239,300 | $126,300 |
| 2016 | $12,811 | $365,600 | $239,300 | $126,300 |
| 2015 | $12,525 | $365,600 | $239,300 | $126,300 |
| 2014 | $12,332 | $365,600 | $239,300 | $126,300 |
Source: Public Records
Map
Nearby Homes