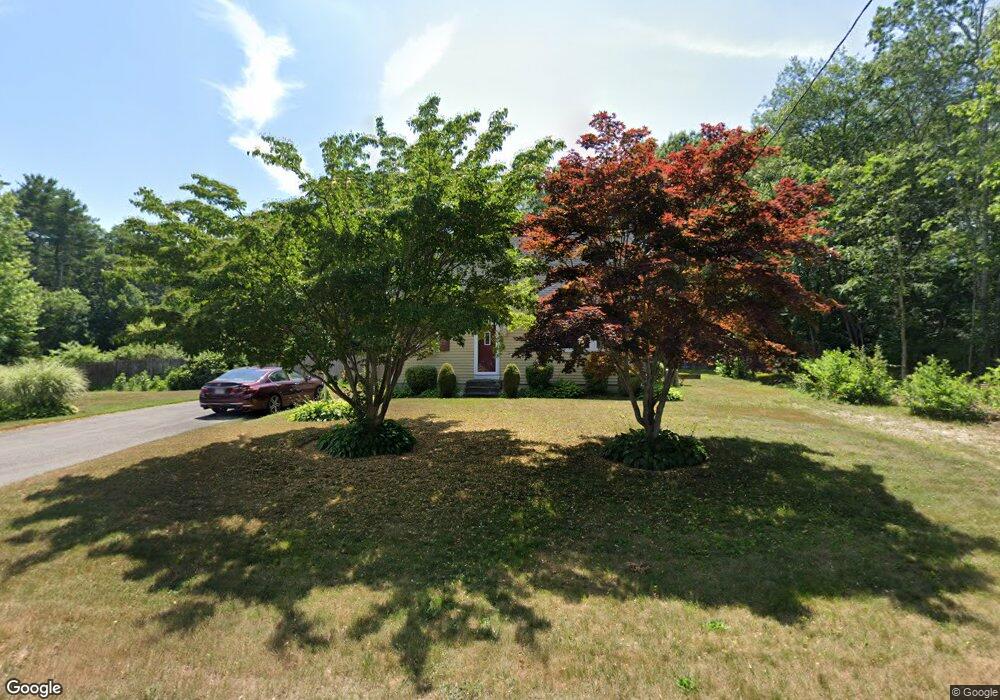
10 Lucas St Carver, MA 02330
Estimated Value: $503,000 - $562,000
3
Beds
2
Baths
1,344
Sq Ft
$395/Sq Ft
Est. Value
About This Home
This home is located at 10 Lucas St, Carver, MA 02330 and is currently estimated at $530,908, approximately $395 per square foot. 10 Lucas St is a home located in Plymouth County with nearby schools including Carver Elementary School, Carver Middle/High School, and Samuel Fuller School.
Ownership History
Date
Name
Owned For
Owner Type
Purchase Details
Closed on
May 13, 2022
Sold by
Dovell Richard M and Dovell Donna M
Bought by
R & Donna Dovell Lt
Current Estimated Value
Purchase Details
Closed on
Oct 14, 1988
Sold by
Aldersley James E
Bought by
Dovell Richard M
Create a Home Valuation Report for This Property
The Home Valuation Report is an in-depth analysis detailing your home's value as well as a comparison with similar homes in the area
Home Values in the Area
Average Home Value in this Area
Purchase History
| Date | Buyer | Sale Price | Title Company |
|---|---|---|---|
| R & Donna Dovell Lt | -- | None Available | |
| Dovell Richard M | $138,000 | -- |
Source: Public Records
Mortgage History
| Date | Status | Borrower | Loan Amount |
|---|---|---|---|
| Previous Owner | Dovell Richard M | $200,000 | |
| Previous Owner | Dovell Richard M | $160,000 | |
| Previous Owner | Dovell Richard M | $144,300 |
Source: Public Records
Tax History Compared to Growth
Tax History
| Year | Tax Paid | Tax Assessment Tax Assessment Total Assessment is a certain percentage of the fair market value that is determined by local assessors to be the total taxable value of land and additions on the property. | Land | Improvement |
|---|---|---|---|---|
| 2025 | $5,820 | $419,600 | $131,800 | $287,800 |
| 2024 | $5,552 | $391,800 | $129,200 | $262,600 |
| 2023 | $5,366 | $367,800 | $129,200 | $238,600 |
| 2022 | $5,069 | $317,200 | $110,500 | $206,700 |
| 2021 | $5,045 | $297,800 | $98,600 | $199,200 |
| 2020 | $4,817 | $280,200 | $92,200 | $188,000 |
| 2019 | $4,650 | $272,700 | $89,500 | $183,200 |
| 2018 | $4,495 | $250,900 | $89,500 | $161,400 |
| 2017 | $4,246 | $240,000 | $86,100 | $153,900 |
| 2016 | $3,912 | $229,700 | $82,000 | $147,700 |
| 2015 | $3,841 | $225,800 | $82,000 | $143,800 |
| 2014 | $3,832 | $225,300 | $103,700 | $121,600 |
Source: Public Records
Map
Nearby Homes
- 35 Silva St
- 269 Purchase St
- 70 Wall St
- 7 Green St
- 26 Santana Way Unit 26
- Lot1 Elk Run Dr
- 11 Brockton Ave
- 135 Plymouth St
- 81 Center St
- 235 Main St
- 6 Susan Cir
- 140 Tispaquin St
- 13 Pond View Way
- 122 High St
- 56 Bunnys Rd
- 48 S Meadow Village
- 146 S Meadow Rd
- 129 Thomas St
- 22 S Meadow Village
- 29 S Meadow Village