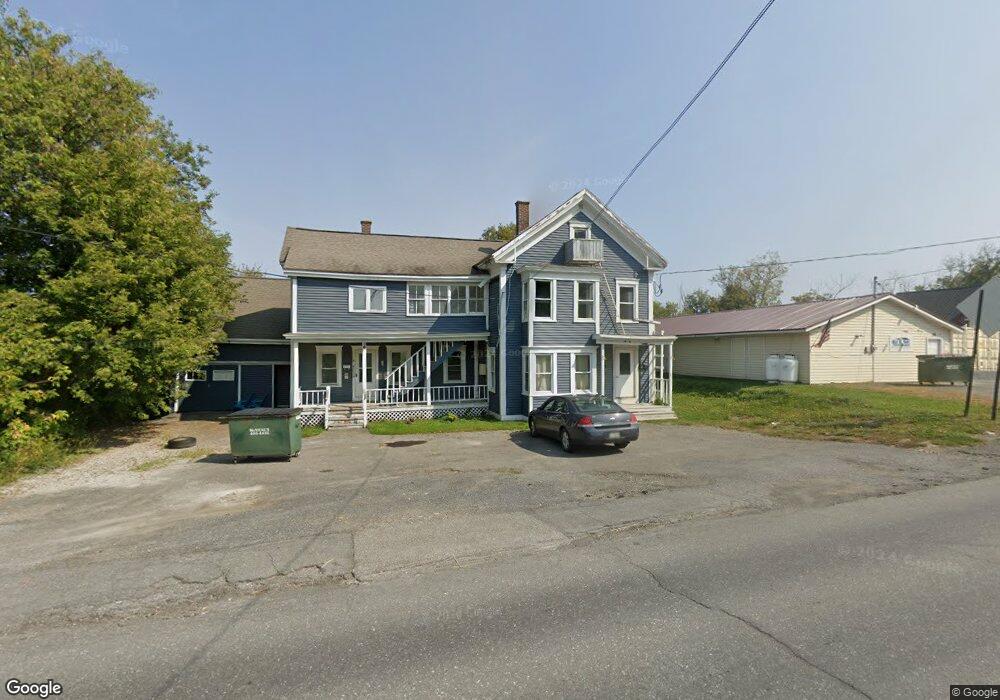
10 Lyndon St Caribou, ME 04736
Estimated Value: $143,000 - $201,000
--
Bed
4
Baths
1,100
Sq Ft
$149/Sq Ft
Est. Value
About This Home
This home is located at 10 Lyndon St, Caribou, ME 04736 and is currently estimated at $163,695, approximately $148 per square foot. 10 Lyndon St is a home located in Aroostook County.
Ownership History
Date
Name
Owned For
Owner Type
Purchase Details
Closed on
Aug 31, 2022
Sold by
Fern Puay L
Bought by
Elizabeth Hekla Me Llc and John Hekla Me Llc
Current Estimated Value
Home Financials for this Owner
Home Financials are based on the most recent Mortgage that was taken out on this home.
Original Mortgage
$223,533
Outstanding Balance
$213,472
Interest Rate
5.54%
Mortgage Type
Purchase Money Mortgage
Estimated Equity
-$49,777
Purchase Details
Closed on
Nov 1, 2017
Sold by
Labbe Patrick C and Labbe Beverly A
Bought by
Fern Robert F and Fern Puay L
Home Financials for this Owner
Home Financials are based on the most recent Mortgage that was taken out on this home.
Original Mortgage
$125,000
Interest Rate
3.13%
Mortgage Type
New Conventional
Create a Home Valuation Report for This Property
The Home Valuation Report is an in-depth analysis detailing your home's value as well as a comparison with similar homes in the area
Home Values in the Area
Average Home Value in this Area
Purchase History
| Date | Buyer | Sale Price | Title Company |
|---|---|---|---|
| Elizabeth Hekla Me Llc | $107,700 | None Available | |
| Fern Robert F | -- | -- |
Source: Public Records
Mortgage History
| Date | Status | Borrower | Loan Amount |
|---|---|---|---|
| Open | Elizabeth Hekla Me Llc | $223,533 | |
| Previous Owner | Fern Robert F | $125,000 |
Source: Public Records
Tax History Compared to Growth
Tax History
| Year | Tax Paid | Tax Assessment Tax Assessment Total Assessment is a certain percentage of the fair market value that is determined by local assessors to be the total taxable value of land and additions on the property. | Land | Improvement |
|---|---|---|---|---|
| 2024 | $2,339 | $109,300 | $11,300 | $98,000 |
| 2023 | $2,131 | $109,300 | $11,300 | $98,000 |
| 2022 | $1,594 | $67,700 | $9,800 | $57,900 |
| 2021 | $1,594 | $67,700 | $9,800 | $57,900 |
| 2020 | $1,594 | $67,700 | $9,800 | $57,900 |
| 2019 | $1,662 | $67,700 | $9,800 | $57,900 |
| 2018 | $1,604 | $67,700 | $9,800 | $57,900 |
| 2017 | $1,618 | $67,700 | $9,800 | $57,900 |
| 2016 | $1,550 | $67,700 | $9,800 | $57,900 |
| 2015 | $1,521 | $67,700 | $9,800 | $57,900 |
| 2014 | $1,510 | $67,700 | $9,800 | $57,900 |
Source: Public Records
Map
Nearby Homes