Estimated Value: $759,000 - $846,000
3
Beds
4
Baths
2,000
Sq Ft
$407/Sq Ft
Est. Value
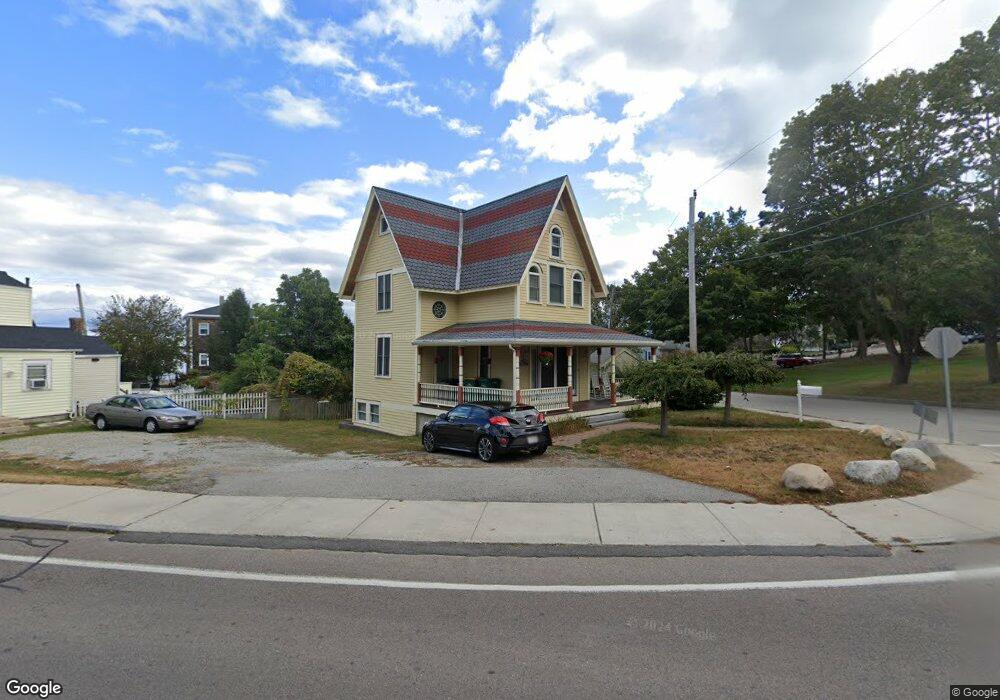
About This Home
This home is located at 10 Main St, Hull, MA 02045 and is currently estimated at $813,062, approximately $406 per square foot. 10 Main St is a home located in Plymouth County with nearby schools including Lillian M. Jacobs Elementary School, Hull High School, and Memorial Middle School.
Ownership History
Date
Name
Owned For
Owner Type
Purchase Details
Closed on
Jun 20, 2006
Sold by
Fay Donna M
Bought by
Fay Donna M and Santangelo Sharon
Current Estimated Value
Purchase Details
Closed on
Jul 18, 2002
Sold by
Conwell John E and Conwell Barbara R
Bought by
Fay Donna M
Home Financials for this Owner
Home Financials are based on the most recent Mortgage that was taken out on this home.
Original Mortgage
$210,000
Interest Rate
6.73%
Mortgage Type
Purchase Money Mortgage
Purchase Details
Closed on
Oct 27, 1999
Sold by
Patterson Richard H and Patterson Kathleen A
Bought by
Conwell John E and Conwell Barbara R
Create a Home Valuation Report for This Property
The Home Valuation Report is an in-depth analysis detailing your home's value as well as a comparison with similar homes in the area
Purchase History
| Date | Buyer | Sale Price | Title Company |
|---|---|---|---|
| Fay Donna M | -- | -- | |
| Fay Donna M | $175,000 | -- | |
| Conwell John E | $161,000 | -- |
Source: Public Records
Mortgage History
| Date | Status | Borrower | Loan Amount |
|---|---|---|---|
| Open | Conwell John E | $371,000 | |
| Previous Owner | Conwell John E | $434,000 | |
| Previous Owner | Conwell John E | $210,000 |
Source: Public Records
Tax History
| Year | Tax Paid | Tax Assessment Tax Assessment Total Assessment is a certain percentage of the fair market value that is determined by local assessors to be the total taxable value of land and additions on the property. | Land | Improvement |
|---|---|---|---|---|
| 2025 | $7,188 | $641,800 | $195,000 | $446,800 |
| 2024 | $6,722 | $577,000 | $171,700 | $405,300 |
| 2023 | $6,635 | $545,200 | $166,200 | $379,000 |
| 2022 | $6,571 | $524,000 | $155,100 | $368,900 |
| 2021 | $6,434 | $507,400 | $138,500 | $368,900 |
| 2020 | $5,878 | $458,500 | $138,500 | $320,000 |
| 2019 | $6,499 | $498,000 | $133,000 | $365,000 |
| 2018 | $6,188 | $461,100 | $133,000 | $328,100 |
| 2017 | $6,200 | $451,900 | $133,000 | $318,900 |
| 2016 | $5,934 | $440,200 | $121,900 | $318,300 |
| 2015 | $5,951 | $426,900 | $110,800 | $316,100 |
| 2014 | $5,667 | $408,600 | $110,800 | $297,800 |
Source: Public Records
Map
Nearby Homes
- 10 Main St
- 109 Spring St
- 6 Main St
- 107 Spring St
- 4 Main St
- 0 Mount Pleasant Ave
- 25 James Ave
- 27 James Ave
- 113 Spring St
- 25 James Ave 15k July Aug 6k May Unit Jun
- 2 Main St
- 105 Spring St
- 0 Main St
- 16 Main St
- 110 Spring St
- 110 Spring St Unit 1
- 110 Spring St Unit 2
- 115 Spring St
- 5 Highland Ave
- 3 Main St
Your Personal Tour Guide
Ask me questions while you tour the home.