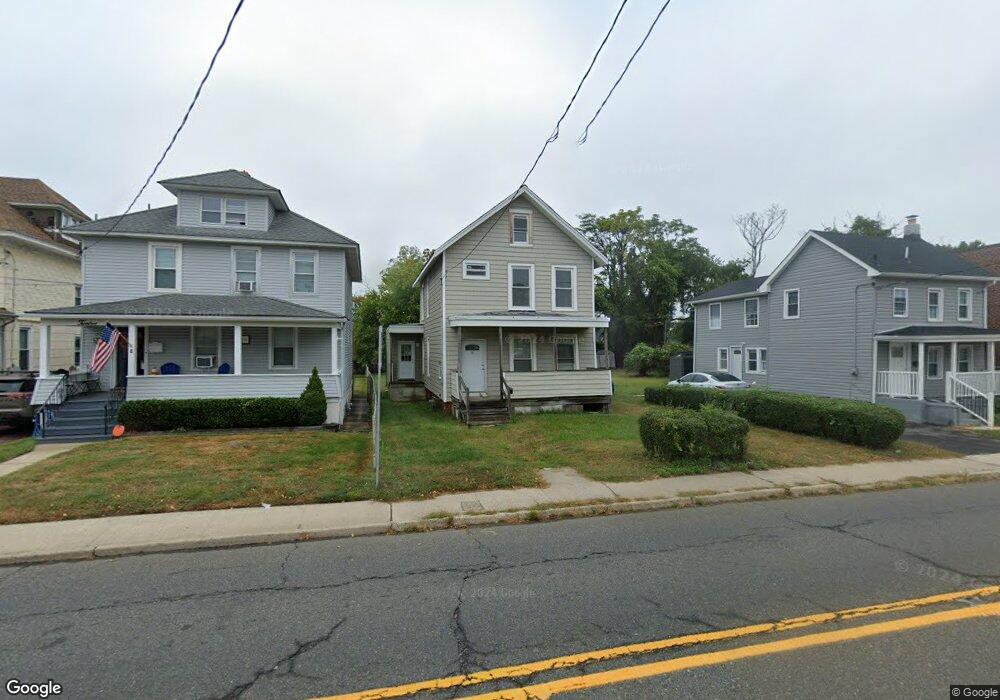
10 Main St Matawan, NJ 07747
Estimated Value: $358,000 - $465,000
3
Beds
1
Bath
1,484
Sq Ft
$286/Sq Ft
Est. Value
About This Home
This home is located at 10 Main St, Matawan, NJ 07747 and is currently estimated at $424,216, approximately $285 per square foot. 10 Main St is a home located in Monmouth County with nearby schools including Matawan Reg High School, St. Joseph Elementary School, and Icob Academy.
Ownership History
Date
Name
Owned For
Owner Type
Purchase Details
Closed on
Dec 19, 2007
Sold by
Douglas Gloria M
Bought by
Douglas Gloria M and Beale Howard W
Current Estimated Value
Purchase Details
Closed on
Dec 19, 2006
Sold by
Parisi James V
Bought by
Douglas Gloria M
Home Financials for this Owner
Home Financials are based on the most recent Mortgage that was taken out on this home.
Original Mortgage
$136,000
Outstanding Balance
$81,221
Interest Rate
6.29%
Mortgage Type
New Conventional
Estimated Equity
$342,995
Create a Home Valuation Report for This Property
The Home Valuation Report is an in-depth analysis detailing your home's value as well as a comparison with similar homes in the area
Home Values in the Area
Average Home Value in this Area
Purchase History
| Date | Buyer | Sale Price | Title Company |
|---|---|---|---|
| Douglas Gloria M | -- | Transnation Title Ins Co | |
| Douglas Gloria M | $170,000 | -- |
Source: Public Records
Mortgage History
| Date | Status | Borrower | Loan Amount |
|---|---|---|---|
| Open | Douglas Gloria M | $136,000 |
Source: Public Records
Tax History
| Year | Tax Paid | Tax Assessment Tax Assessment Total Assessment is a certain percentage of the fair market value that is determined by local assessors to be the total taxable value of land and additions on the property. | Land | Improvement |
|---|---|---|---|---|
| 2025 | $6,289 | $328,300 | $175,300 | $153,000 |
| 2024 | $5,687 | $288,100 | $166,300 | $121,800 |
| 2023 | $5,687 | $261,600 | $139,300 | $122,300 |
| 2022 | $6,056 | $233,300 | $116,800 | $116,500 |
| 2021 | $4,390 | $222,900 | $116,800 | $106,100 |
| 2020 | $5,447 | $199,100 | $94,300 | $104,800 |
| 2019 | $4,873 | $178,500 | $76,300 | $102,200 |
| 2018 | $4,923 | $177,400 | $85,300 | $92,100 |
| 2017 | $4,943 | $175,600 | $85,300 | $90,300 |
| 2016 | $4,806 | $174,400 | $85,300 | $89,100 |
| 2015 | $4,674 | $170,900 | $85,300 | $85,600 |
| 2014 | $4,736 | $173,800 | $85,300 | $88,500 |
Source: Public Records
Map
Nearby Homes
- 207 Lower Main St
- 3 Harrison Ave
- 154 Lower Main St
- 10 Johnson Ave
- 68 Main St
- 49 Lucia Ct
- 55 Lower Main St
- 259 Matawan Ave
- 3 Noble Place
- 284 Washington St
- 227 W Prospect Ave
- 9 Fountain Ave
- 52 Highway 35
- 369 Riverdale Dr
- 255 Harding Blvd
- 253 Broadway
- 190 Jackson St
- 11 Anton Place
- 97D Aberdeen Rd
- 65 Ravine Dr
- 8 Main St
- 6 Main St
- 14 Main St
- 239 Main St
- 4 Main St
- 16 Main St
- 2 1/2 Main St
- 18 Main St
- 2 Main St Unit 12
- 57-57 1/2 Atlantic Ave
- 3 Atlantic Ave
- 164 Lower Main St
- 211 Lower Main St
- 144 Highfield Ave
- 5 Atlantic Ave
- 162 Lower Main St
- 209 Lower Main St
- 160 Lower Main St
- 140 Highfield Ave
- 7 Atlantic Ave
Your Personal Tour Guide
Ask me questions while you tour the home.