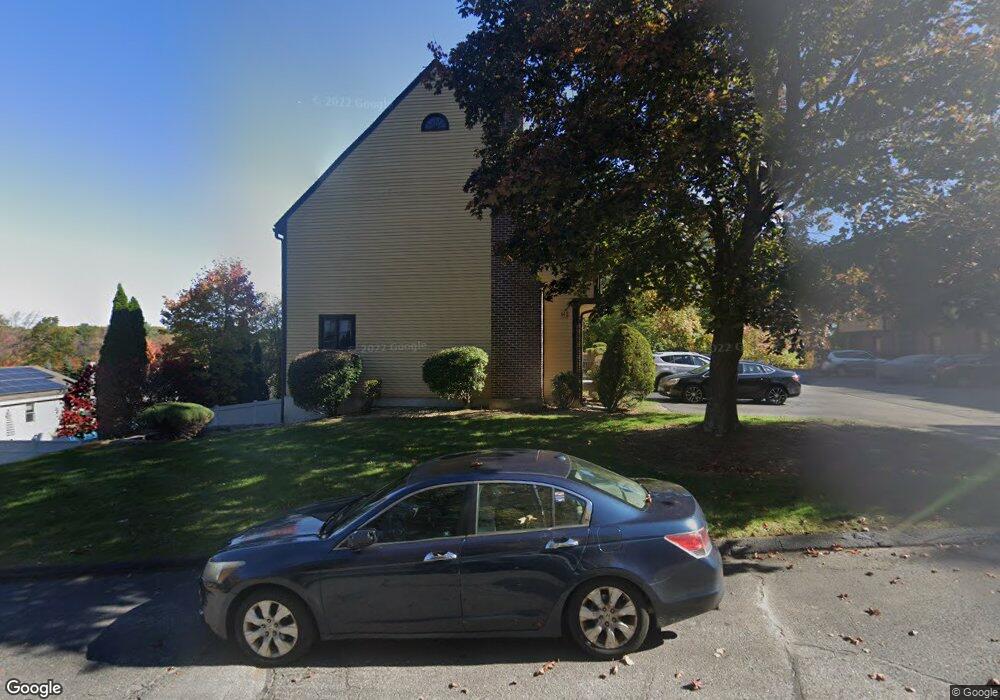
10 Malburn Terrace Leominster, MA 01453
Estimated Value: $338,000 - $363,224
2
Beds
3
Baths
2,141
Sq Ft
$164/Sq Ft
Est. Value
About This Home
This home is located at 10 Malburn Terrace, Leominster, MA 01453 and is currently estimated at $351,306, approximately $164 per square foot. 10 Malburn Terrace is a home located in Worcester County with nearby schools including Leominster High School, St. Anna Catholic School, and St. Leo School.
Ownership History
Date
Name
Owned For
Owner Type
Purchase Details
Closed on
Feb 29, 2016
Sold by
National Res Nominee S
Bought by
Rodriguez Alexis C
Current Estimated Value
Home Financials for this Owner
Home Financials are based on the most recent Mortgage that was taken out on this home.
Original Mortgage
$125,600
Outstanding Balance
$100,295
Interest Rate
3.92%
Mortgage Type
New Conventional
Estimated Equity
$251,011
Purchase Details
Closed on
Sep 17, 2009
Sold by
Dickhaut G James and Dickhaut Barbara G
Bought by
Rippere Mathew Ee and Phillips Kristy M
Home Financials for this Owner
Home Financials are based on the most recent Mortgage that was taken out on this home.
Original Mortgage
$173,794
Interest Rate
5.28%
Mortgage Type
Purchase Money Mortgage
Purchase Details
Closed on
Apr 18, 2002
Sold by
Vp Holman Constr
Bought by
Dickhaut G James and Dickhaut Barbara G
Create a Home Valuation Report for This Property
The Home Valuation Report is an in-depth analysis detailing your home's value as well as a comparison with similar homes in the area
Home Values in the Area
Average Home Value in this Area
Purchase History
| Date | Buyer | Sale Price | Title Company |
|---|---|---|---|
| Rodriguez Alexis C | $157,000 | -- | |
| Rippere Mathew Ee | $177,000 | -- | |
| Dickhaut G James | $164,900 | -- |
Source: Public Records
Mortgage History
| Date | Status | Borrower | Loan Amount |
|---|---|---|---|
| Open | Rodriguez Alexis C | $125,600 | |
| Previous Owner | Rippere Mathew Ee | $173,794 | |
| Previous Owner | Dickhaut G James | $16,000 |
Source: Public Records
Tax History Compared to Growth
Tax History
| Year | Tax Paid | Tax Assessment Tax Assessment Total Assessment is a certain percentage of the fair market value that is determined by local assessors to be the total taxable value of land and additions on the property. | Land | Improvement |
|---|---|---|---|---|
| 2025 | $4,188 | $298,500 | $0 | $298,500 |
| 2024 | $3,858 | $265,900 | $0 | $265,900 |
| 2023 | $3,675 | $236,500 | $0 | $236,500 |
| 2022 | $3,127 | $188,800 | $0 | $188,800 |
| 2021 | $3,592 | $198,100 | $0 | $198,100 |
| 2020 | $3,458 | $192,300 | $0 | $192,300 |
| 2019 | $3,350 | $180,700 | $0 | $180,700 |
| 2018 | $2,880 | $149,000 | $0 | $149,000 |
| 2017 | $2,977 | $150,900 | $0 | $150,900 |
| 2016 | $2,878 | $147,000 | $0 | $147,000 |
| 2015 | $3,029 | $155,800 | $0 | $155,800 |
| 2014 | $2,956 | $156,500 | $0 | $156,500 |
Source: Public Records
Map
Nearby Homes
- 498 Lancaster St
- 55 Lakeview St
- 81 Cortland Cir Unit 81
- 6 Longwood Ave
- 49 Meadow Pond Dr Unit C
- 49 Meadow Pond Dr Unit I
- 740 Central St Unit R24
- 30 Abbey Rd Unit 207
- 10 Abbey Rd Unit 205
- 30 Abbey Rd Unit 104
- 30 Abbey Rd Unit 202
- 30 Abbey Rd Unit 108
- 556 Central St Unit 4
- 22 2nd Ave
- 14 Florence St
- 851 Lancaster St
- 197 Chapman Place Unit 197
- 170 Chapman Place
- 31 Johnson St
- 74 Crisci St
- 8 Malburn Terrace
- 8 Malburn Terrace Unit 8
- 10 Malburn Terrace Unit 10
- 6 Malburn Terrace
- 32 Malburn St
- 16 Malburn Terrace
- 14 Malburn Terrace
- 26 Malburn St
- 12 Malburn Terrace
- 20 Malburn St
- 30 Malburn Terrace
- 30 Malburn Terrace Unit 30
- 46 Malburn St
- 2 Malburn Terrace
- 2 Malburn Terrace
- 2 Malburn Terrace Unit 2
- 2 Malburn Terrace Unit H-1-S
- 9 Malburn Terrace
- 4 Malburn Terrace
- 20 Malburn Terrace