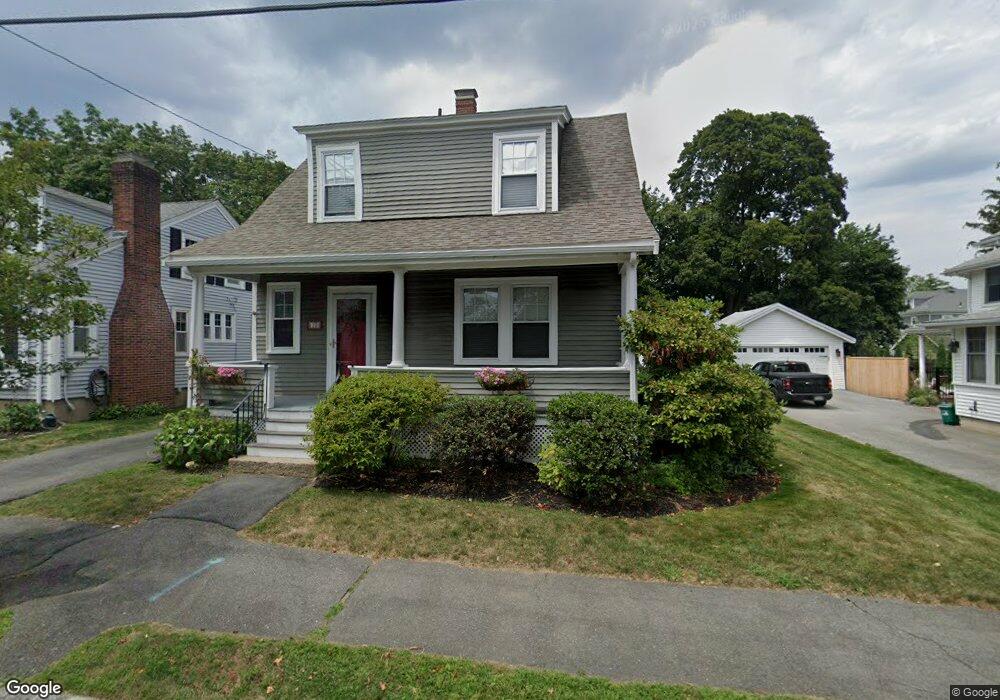
10 Manning St Salem, MA 01970
North Salem NeighborhoodEstimated Value: $656,000 - $775,000
2
Beds
2
Baths
1,958
Sq Ft
$373/Sq Ft
Est. Value
About This Home
This home is located at 10 Manning St, Salem, MA 01970 and is currently estimated at $730,791, approximately $373 per square foot. 10 Manning St is a home located in Essex County with nearby schools including Bates Elementary School, Saltonstall School, and Carlton Elementary School.
Ownership History
Date
Name
Owned For
Owner Type
Purchase Details
Closed on
Feb 19, 2026
Sold by
Hornsby Emily and Hornsby Mitchell R
Bought by
Connelly Catherine
Current Estimated Value
Home Financials for this Owner
Home Financials are based on the most recent Mortgage that was taken out on this home.
Original Mortgage
$430,000
Outstanding Balance
$430,000
Interest Rate
6.16%
Mortgage Type
Purchase Money Mortgage
Estimated Equity
$300,791
Purchase Details
Closed on
Feb 7, 2019
Sold by
Carr Kevin and Carr Maureen P
Bought by
Hornsby Mitchell and Smedick Emily K
Home Financials for this Owner
Home Financials are based on the most recent Mortgage that was taken out on this home.
Original Mortgage
$393,600
Interest Rate
4.4%
Mortgage Type
New Conventional
Purchase Details
Closed on
Jan 1, 1977
Bought by
Carr Kevin R and Carr Maureen P
Create a Home Valuation Report for This Property
The Home Valuation Report is an in-depth analysis detailing your home's value as well as a comparison with similar homes in the area
Home Values in the Area
Average Home Value in this Area
Purchase History
| Date | Buyer | Sale Price | Title Company |
|---|---|---|---|
| Connelly Catherine | $830,000 | -- | |
| Hornsby Mitchell | $492,000 | -- | |
| Carr Kevin R | $60,700 | -- |
Source: Public Records
Mortgage History
| Date | Status | Borrower | Loan Amount |
|---|---|---|---|
| Open | Connelly Catherine | $430,000 | |
| Previous Owner | Hornsby Mitchell | $393,600 | |
| Previous Owner | Carr Kevin R | $133,000 |
Source: Public Records
Tax History
| Year | Tax Paid | Tax Assessment Tax Assessment Total Assessment is a certain percentage of the fair market value that is determined by local assessors to be the total taxable value of land and additions on the property. | Land | Improvement |
|---|---|---|---|---|
| 2025 | $7,165 | $631,800 | $212,400 | $419,400 |
| 2024 | $6,927 | $596,100 | $201,900 | $394,200 |
| 2023 | $6,850 | $547,600 | $186,400 | $361,200 |
| 2022 | $6,536 | $493,300 | $180,100 | $313,200 |
| 2021 | $6,450 | $467,400 | $167,700 | $299,700 |
| 2020 | $5,767 | $399,100 | $158,400 | $240,700 |
| 2019 | $5,741 | $380,200 | $150,300 | $229,900 |
| 2018 | $5,569 | $362,100 | $142,900 | $219,200 |
| 2017 | $5,191 | $327,300 | $120,500 | $206,800 |
| 2016 | $5,041 | $321,700 | $114,900 | $206,800 |
| 2015 | $4,800 | $292,500 | $105,600 | $186,900 |
Source: Public Records
Map
Nearby Homes
- 44 Orne St Unit 44
- 41 Dearborn St
- 17 Orchard St
- 27 Liberty Hill Ave
- 40 Buffum St Unit 2
- 40 Buffum St Unit 1
- 112 North St
- 16 Franklin St Unit 2403
- 16 Franklin St Unit 1303
- 16 Franklin St Unit 2202
- 3 S Mason St
- 1 Dunlap St
- 16 Oakland St
- 8 Cushing St Unit 2
- 49 Federal St Unit 2
- 23 River St
- 9 Highland St
- 17 North St Unit 2
- 65 Washington St Unit 512
- 11 Barton St
- 14 Manning St
- 6 Manning St
- 18 Manning St
- 40 Orne St
- 42 Orne St
- 42 Orne St Unit 42
- 36 Orne St
- 77 Orchard St
- 77 Orchard St Unit 2
- 75 Orchard St
- 44 Orne St Unit 2
- 44 Orne St
- 44 Orne St Unit 1,1
- 20 Manning St
- 9 Manning St
- 13 Manning St
- 5 Manning St
- 5 Manning St Unit 2
- 32 Orne St Unit 34
- 46 Orne St Unit 48
Your Personal Tour Guide
Ask me questions while you tour the home.