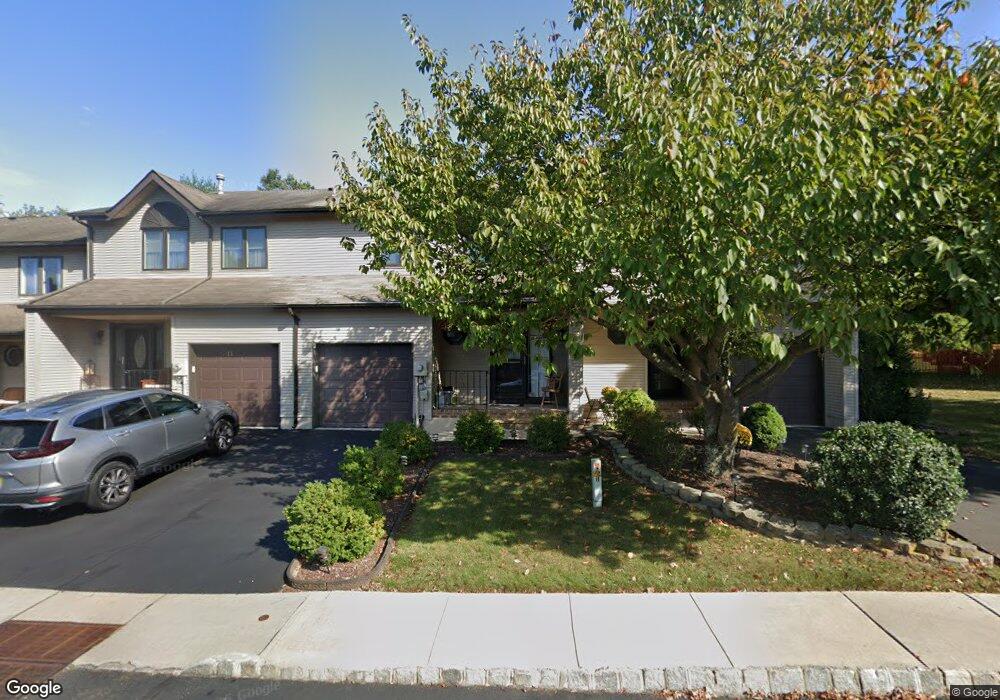
10 Maple Ct Flemington, NJ 08822
Estimated Value: $446,263 - $509,000
Studio
--
Bath
1,756
Sq Ft
$276/Sq Ft
Est. Value
About This Home
This home is located at 10 Maple Ct, Flemington, NJ 08822 and is currently estimated at $485,316, approximately $276 per square foot. 10 Maple Ct is a home located in Hunterdon County with nearby schools including Barley Sheaf Elementary School, J.P. Case Middle School, and Reading Fleming Intermediate School.
Ownership History
Date
Name
Owned For
Owner Type
Purchase Details
Closed on
Feb 3, 2025
Sold by
Myers James E
Bought by
James E Myers Jr Family Trust and Myers
Current Estimated Value
Purchase Details
Closed on
Aug 15, 2001
Sold by
Pennacchio Gary
Bought by
Myers James
Home Financials for this Owner
Home Financials are based on the most recent Mortgage that was taken out on this home.
Original Mortgage
$128,000
Interest Rate
7.21%
Purchase Details
Closed on
Aug 16, 1996
Sold by
Kumar Dinesh and Kumar Rashmi
Bought by
Pennacchio Gary and Pennacchio April
Home Financials for this Owner
Home Financials are based on the most recent Mortgage that was taken out on this home.
Original Mortgage
$138,700
Interest Rate
8.08%
Purchase Details
Closed on
Mar 19, 1991
Sold by
Tallent Mark S and Tallent Karen I
Bought by
Kumar Dinesh and Kumar Rashmi
Create a Home Valuation Report for This Property
The Home Valuation Report is an in-depth analysis detailing your home's value as well as a comparison with similar homes in the area
Home Values in the Area
Average Home Value in this Area
Purchase History
| Date | Buyer | Sale Price | Title Company |
|---|---|---|---|
| James E Myers Jr Family Trust | -- | None Listed On Document | |
| James E Myers Jr Family Trust | -- | None Listed On Document | |
| Myers James | $202,000 | -- | |
| Pennacchio Gary | $147,900 | -- | |
| Kumar Dinesh | $112,000 | -- |
Source: Public Records
Mortgage History
| Date | Status | Borrower | Loan Amount |
|---|---|---|---|
| Previous Owner | Myers James | $128,000 | |
| Previous Owner | Pennacchio Gary | $138,700 |
Source: Public Records
Tax History
| Year | Tax Paid | Tax Assessment Tax Assessment Total Assessment is a certain percentage of the fair market value that is determined by local assessors to be the total taxable value of land and additions on the property. | Land | Improvement |
|---|---|---|---|---|
| 2025 | $7,854 | $271,100 | $110,000 | $161,100 |
| 2024 | $7,385 | $271,100 | $110,000 | $161,100 |
| 2023 | $7,385 | $271,100 | $110,000 | $161,100 |
| 2022 | $7,198 | $271,100 | $110,000 | $161,100 |
| 2021 | $6,829 | $271,100 | $110,000 | $161,100 |
| 2020 | $6,970 | $271,100 | $110,000 | $161,100 |
| 2019 | $6,829 | $271,100 | $110,000 | $161,100 |
| 2018 | $6,745 | $271,100 | $110,000 | $161,100 |
| 2017 | $6,642 | $271,100 | $110,000 | $161,100 |
| 2016 | $6,523 | $271,100 | $110,000 | $161,100 |
| 2015 | $6,357 | $271,100 | $110,000 | $161,100 |
| 2014 | $6,273 | $271,100 | $110,000 | $161,100 |
Source: Public Records
Map
Nearby Homes
- 6 Elm Terrace
- 822 Poplar Ct Unit 822
- 265 Spruce Ct Unit 265
- 269 Spruce Ct Unit 269
- 107 Samson Dr
- 6 Dogwood Cir
- 8 Dogwood Cir
- 3 Meadow Lark Ct
- 317 Jamestown Ct
- 418 Hawthorne Ct
- 211 Reaville Rd
- 18 Burnett Ct
- 12 Higgins Ct
- 208 Blackberry Ct
- 106 Franklin Ct Unit 238
- 908 Reed Ct
- 16 Aberdeen Cir
- 603 Nottingham Way
- 215 Kuhl Rd
- 6 Canterberry Cir
Your Personal Tour Guide
Ask me questions while you tour the home.