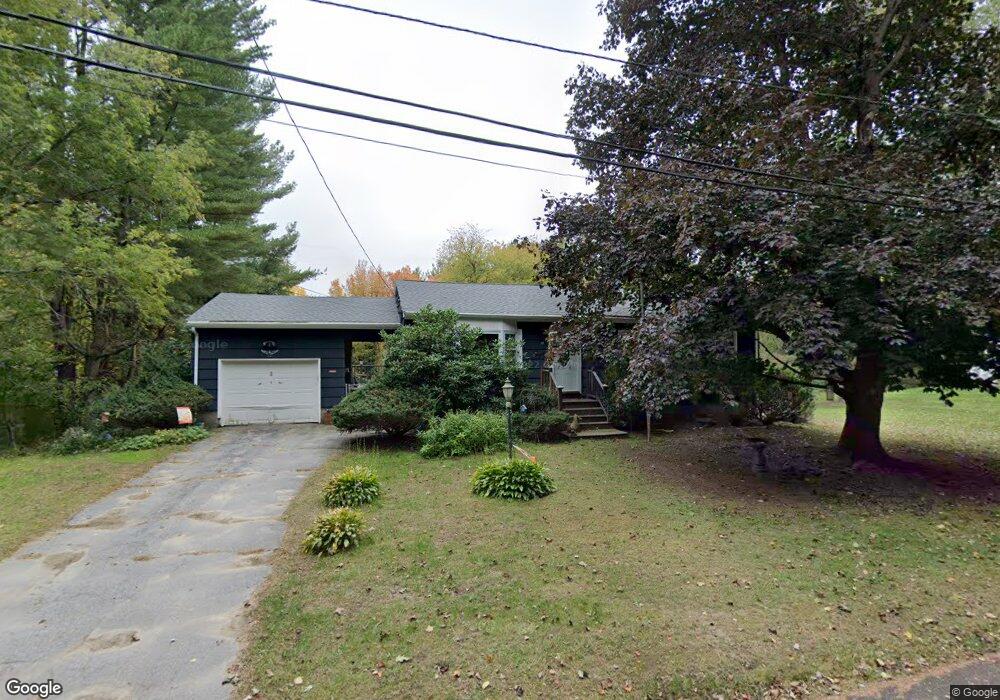
10 Maple St Methuen, MA 01844
The North End NeighborhoodEstimated Value: $523,052 - $604,000
3
Beds
1
Bath
1,120
Sq Ft
$490/Sq Ft
Est. Value
About This Home
This home is located at 10 Maple St, Methuen, MA 01844 and is currently estimated at $548,263, approximately $489 per square foot. 10 Maple St is a home located in Essex County with nearby schools including Methuen High School, Hilltop School, and Saint Monica School.
Ownership History
Date
Name
Owned For
Owner Type
Purchase Details
Closed on
Oct 17, 1996
Sold by
Wildman Barbara
Bought by
Derench Jean R
Current Estimated Value
Home Financials for this Owner
Home Financials are based on the most recent Mortgage that was taken out on this home.
Original Mortgage
$56,100
Outstanding Balance
$5,229
Interest Rate
8.26%
Mortgage Type
Purchase Money Mortgage
Estimated Equity
$543,034
Create a Home Valuation Report for This Property
The Home Valuation Report is an in-depth analysis detailing your home's value as well as a comparison with similar homes in the area
Home Values in the Area
Average Home Value in this Area
Purchase History
| Date | Buyer | Sale Price | Title Company |
|---|---|---|---|
| Derench Jean R | $112,200 | -- |
Source: Public Records
Mortgage History
| Date | Status | Borrower | Loan Amount |
|---|---|---|---|
| Open | Derench Jean R | $56,100 | |
| Previous Owner | Derench Jean R | $85,000 |
Source: Public Records
Tax History
| Year | Tax Paid | Tax Assessment Tax Assessment Total Assessment is a certain percentage of the fair market value that is determined by local assessors to be the total taxable value of land and additions on the property. | Land | Improvement |
|---|---|---|---|---|
| 2025 | $4,973 | $470,000 | $246,000 | $224,000 |
| 2024 | $4,871 | $448,500 | $224,500 | $224,000 |
| 2023 | $4,624 | $395,200 | $199,600 | $195,600 |
| 2022 | $4,425 | $339,100 | $166,500 | $172,600 |
| 2021 | $4,167 | $315,900 | $158,200 | $157,700 |
| 2020 | $4,169 | $310,200 | $158,200 | $152,000 |
| 2019 | $3,915 | $275,900 | $141,600 | $134,300 |
| 2018 | $3,841 | $269,200 | $141,500 | $127,700 |
| 2017 | $3,758 | $256,500 | $141,500 | $115,000 |
| 2016 | $3,591 | $242,500 | $133,300 | $109,200 |
| 2015 | $3,489 | $239,000 | $133,300 | $105,700 |
Source: Public Records
Map
Nearby Homes
- 55 Phoebe St Unit 32
- 40 Phoebe St Unit 101
- 127 Phoebe St Unit 67
- 125 Phoebe St Unit 125
- 2 Sequoia Dr Unit 2
- 64 Pine Tree Dr Unit 64
- 47 Bailey Ct
- 11 Brookside Ct
- 7 Tree Top Way
- 12 Scotland Heights Rd
- 34 Danforth Ct Unit 34
- 159-161 Howe St
- 139 North St
- 3 Adams Ave
- 27 Littlefield Ct Unit 27
- 41 Brookdale Ave
- 7 Germaine Ave
- 29 Emma Rose Cir Unit Lot 22
- 26 Emma Rose Cir Unit Lot 1
- 3 Lucy Way
Your Personal Tour Guide
Ask me questions while you tour the home.