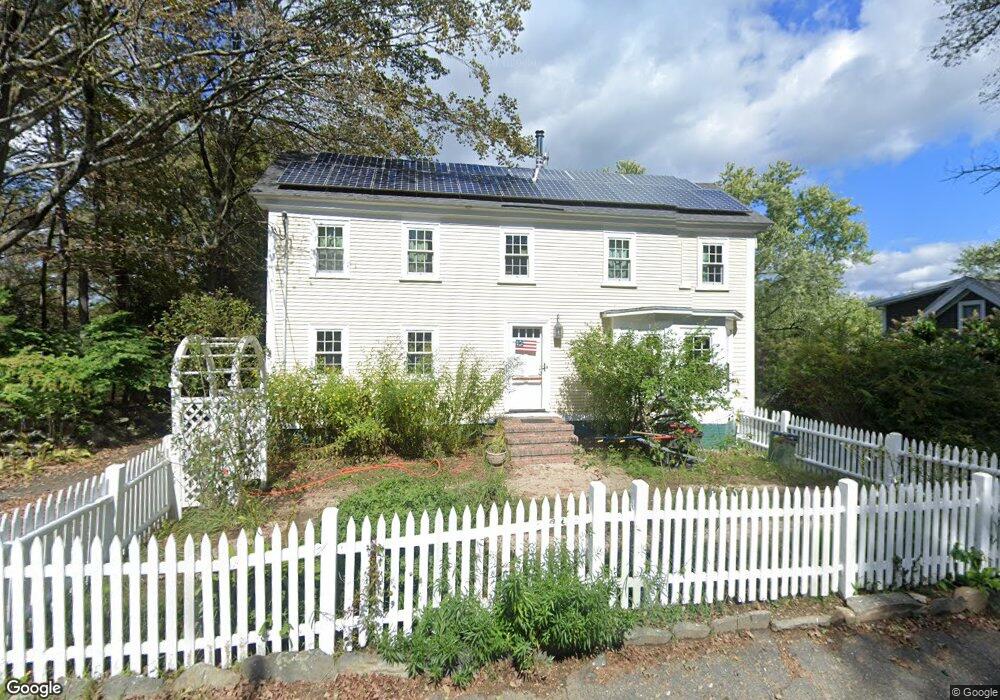
10 Maple St Sherborn, MA 01770
Estimated Value: $731,703 - $852,000
3
Beds
2
Baths
1,155
Sq Ft
$677/Sq Ft
Est. Value
About This Home
This home is located at 10 Maple St, Sherborn, MA 01770 and is currently estimated at $782,176, approximately $677 per square foot. 10 Maple St is a home located in Middlesex County with nearby schools including Pine Hill Elementary School, Dover-Sherborn Regional Middle School, and Dover-Sherborn Regional High School.
Ownership History
Date
Name
Owned For
Owner Type
Purchase Details
Closed on
Mar 11, 2020
Sold by
Callery Mary B
Bought by
Mary Beth Callery Lt and Callery
Current Estimated Value
Purchase Details
Closed on
Aug 21, 2012
Sold by
Munson Lee E
Bought by
Callery Mary B
Purchase Details
Closed on
Apr 15, 2004
Sold by
Merrill Sara Sullivan
Bought by
Munson Lee E
Home Financials for this Owner
Home Financials are based on the most recent Mortgage that was taken out on this home.
Original Mortgage
$316,400
Interest Rate
5.58%
Mortgage Type
Purchase Money Mortgage
Purchase Details
Closed on
Nov 30, 1993
Sold by
Ouellet Thomas E and Ouellet Maryanne
Bought by
Merrill Sara S
Create a Home Valuation Report for This Property
The Home Valuation Report is an in-depth analysis detailing your home's value as well as a comparison with similar homes in the area
Home Values in the Area
Average Home Value in this Area
Purchase History
| Date | Buyer | Sale Price | Title Company |
|---|---|---|---|
| Mary Beth Callery Lt | -- | None Available | |
| Mary Beth Callery Lt | -- | None Available | |
| Mary Beth Callery Lt | -- | None Available | |
| Callery Mary B | -- | -- | |
| Callery Mary B | -- | -- | |
| Munson Lee E | $395,500 | -- | |
| Munson Lee E | $395,500 | -- | |
| Merrill Sara S | $218,500 | -- | |
| Merrill Sara S | $218,500 | -- |
Source: Public Records
Mortgage History
| Date | Status | Borrower | Loan Amount |
|---|---|---|---|
| Previous Owner | Merrill Sara S | $200,000 | |
| Previous Owner | Munson Lee E | $316,400 |
Source: Public Records
Tax History
| Year | Tax Paid | Tax Assessment Tax Assessment Total Assessment is a certain percentage of the fair market value that is determined by local assessors to be the total taxable value of land and additions on the property. | Land | Improvement |
|---|---|---|---|---|
| 2025 | $11,017 | $664,500 | $359,100 | $305,400 |
| 2024 | $20,360 | $600,600 | $301,600 | $299,000 |
| 2023 | $10,275 | $570,500 | $301,600 | $268,900 |
| 2022 | $9,819 | $516,000 | $301,500 | $214,500 |
| 2021 | $10,066 | $512,800 | $301,500 | $211,300 |
| 2020 | $9,567 | $491,600 | $301,500 | $190,100 |
| 2019 | $9,229 | $470,400 | $301,500 | $168,900 |
| 2018 | $9,079 | $470,400 | $301,500 | $168,900 |
| 2017 | $8,898 | $434,900 | $286,400 | $148,500 |
| 2016 | $8,901 | $432,700 | $286,400 | $146,300 |
| 2015 | $8,640 | $425,200 | $278,400 | $146,800 |
| 2014 | $8,156 | $401,000 | $261,400 | $139,600 |
Source: Public Records
Map
Nearby Homes
- 90 Maple St
- 14 Sewall Brook Ln
- 65 Farm Road Lot 6
- 137 Lake St
- 32 Cider Hill Ln
- 174 S Main St
- 124 Everett St
- 6 Hopewell Farm Rd
- 11 Morgan Dr Unit 404
- 81 Brush Hill Rd
- 7 Allison Way Unit 7
- 20 Nason Hill Rd
- 220 South Main St
- 16 Wayside Rd Unit 14
- 5 Lanes End
- 1 Fern St
- 28 Sylvester Rd
- 11 Weld St Unit 37
- 7 Weld St Unit 50
- 7 Weld St Unit 29
Your Personal Tour Guide
Ask me questions while you tour the home.